Figures & data
Table 1. Fluorescence resonance energy transfer-quantitative RT-PCR primers and probes
Figure 1. IBV respiratory cases in Alabama broilers (n = 322) in the period 1997 to 2002 and the extent of thymic or bursal lymphocytic depletion by age of submission. Predicted (pred) bursal or thymic (Tpred) lymphocytic depletion and IBV isolations (IBVpred) by polynomial regression. All terms in the models significant at P < 0.05.
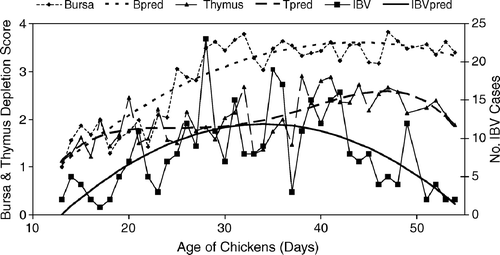
Figure 2. Predicted serotype frequency versus age from a generalized logit model using the Ark 99 strain as the reference or baseline (Agresti, Citation1990). Ark-vaccine-like strains were most frequent between days 27 and 43 of age, coinciding with immunodeficiency (). Wild-type strains such as variant strains or Ark99 (P = 0.01) maintained a similar frequency throughout the production period of the broilers.
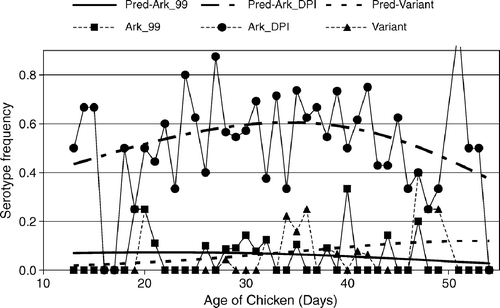
Table 2. Infectious bronchitis viruses isolated from broilers in Alabama, 1997 to 2002
Figure 3. Nucleotide identities (%) and amino acid similarities (%) of IBV field isolates AL/4614/98 and AL/7149/00 with sequences representative of serotypes or S1 RFLP patterns frequently isolated in Alabama: Ark 99, AL/9021/97 (representative of Alabama isolates with an RFLP pattern similar, but not identical, to ArkDPI), Ark DPI, DE072, GA6305/97 (representative of GA98 RFLP pattern) and M41 (GenBank accession numbers L10384, AY101766, AF006624, AF274435, AF338716, AY561711, respectively). *Alabama isolates AL/7149/00 and AL/9021/97 are not identical. They have two nucleotide differences (99.9% identical), each resulting in an amino acid difference (99.6% identical).
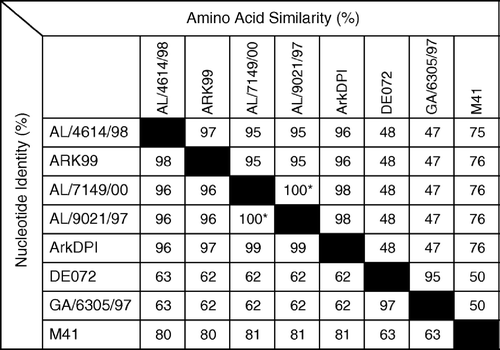
Figure 4. Audible nasal and tracheal rales by day in chickens (26 per group) infected with CAV + IBDV or with IBV alone. DPI = days post IBV inoculation. The total incidence of nasal and tracheal rales from days 8 to 16 was significantly higher (P = 0.04) in CAV + IBDV-infected chickens (Fisher's exact test).
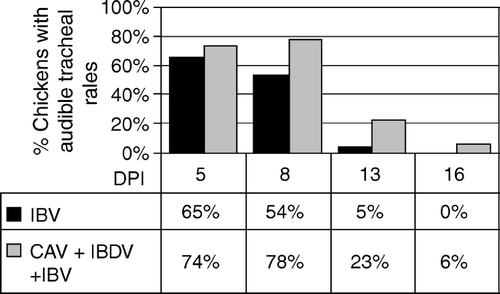
Figure 5. Histopathological changes due to IBV in immunodeficient (infected with CAV and IBDV at day 7 of age) and immunocompetent chickens inoculated with IBV at day 15 of age. 5a: Severity of tracheal lesions. Lesions (deciliation, epithelium necrosis, mononuclear cell infiltration, epithelial hyperplasia, Goblet cell hyperplasia or hypertrophy, and attenuation of mucus gland epithelium) graded 1 = normal, 2 = mild lesion, 3 = moderate, and 4 = marked to severe (minimum total score for six parameters = 6). P < 0.05 for IBV versus IBV + CAV + IBDV are shown. IBV + CAV + IBDV different from control (P < 0.01) for all time points. 5b: Mean tracheal mucosal thickness as determined by histomorphometry. Only P < 0.05 for infected versus uninfected controls are shown. 5c: Mononuclear cell infiltration in the tracheal mucosa as determined by histomorphometry. P < 0.05 for IBV versus IBV + CAV + IBDV are shown. IBV + CAV + IBDV different from control (P < 0.01) for all time points. Immunocompetent chickens showed significantly higher (P < 0.05) mononuclear cell infiltration than uninfected chickens at day 9 after IBV infection and declined linearly through day 19 until a plateau. Immunodeficient and control chickens maintained similar values throughout the experimental period.
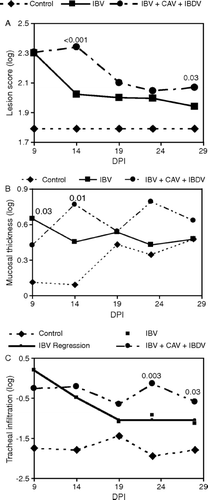
Figure 6. IBV-specific IgA measured in lachrymal fluids by enzyme-linked immunosorbent assay. Mean absorbance versus day post IBV inoculation. Error bars indicate the standard error of the mean.
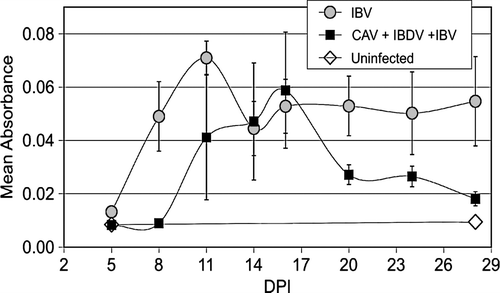
Figure 7. Detection of IBV by RT-PCR in samples isolated from trachea of chickens necropsied at the indicated days post IBV inoculation (DPI). All PCR reactions were conducted for 40 cycles using primers recognizing the N gene. 7a: Thirty-fold serial dilutions of template (pooled from five chickens) were used to allow comparison of the relative amount of IBV RNA present in tracheal samples of each group. 7b: Undiluted samples from individual chickens were used as template.
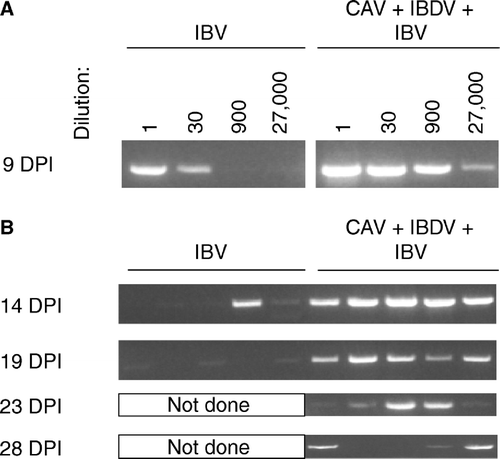
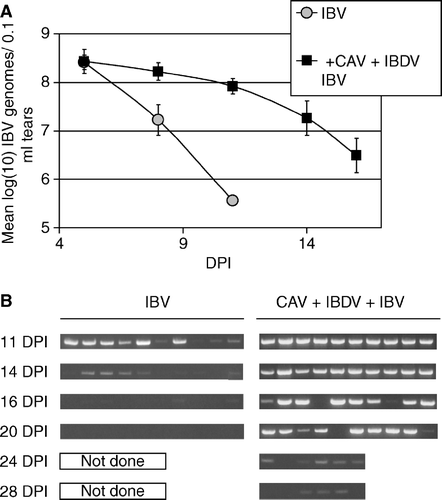
Figure 8. 8a: IBV genomes detected in tears by fluorescence resonance energy transfer-quantitative RT-PCR. RNA was prepared from 10 chickens of each group at each time point indicated (DPI = days post IBV inoculation) and assayed individually. Samples with IBV RNA levels below the limit of detection of this assay, but with IBV RNA detectable by the non-quantitative RT-PCR shown in (8b), were assigned the value of the lower limit of detection of the qRT-PCR assay. Therefore, the mean value shown is a theoretical maximum mean, and the actual mean is lower. Error bars indicate one standard error of the mean. 8b: IBV genomes detected in tears collected from individual chickens were detected by conventional RT-PCR using primers recognizing the N gene.