Figures & data
Figure 1. Percentage of broilers per group showing clinical signs and clinical score indices from (1a) Experiment 1 and (1b) Experiment 2. Bar graph shows the percentage of birds/group showing clinical signs, line graph shows clinical score indices of the groups. n = 5/group and experimental day. Clinical score index = the sum of scores observed/total number of chickens per group at each day point. Chickens that received virus-free TOC medium were free of clinical signs throughout both experiments.
Figure 2. Clinical signs of aMPV-infected broilers at 9 d.p.i. 2a: Control broiler. 2b: aMPV subtype-B-inoculated broiler showing swelling of periorbital sinuses and the area around the eye (black arrow) and clear nasal exudate (white arrow). These clinical signs were also observed in aMPV subtype-A-inoculated birds (data not shown).
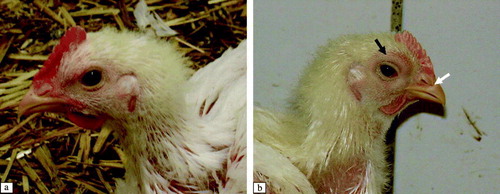
Figure 3. Histopathological lesions in the nasal turbinate at 6 d.p.i. (H & E stain, 200x magnification). 3a: Intact ciliated epithelium of a control broiler (arrows). 3b: Nasal turbinate of an aMPV subtype-B-inoculated broiler showing infiltration of lymphoid cells in the epithelium (black arrow) and hypertrophy of the mucous gland (white arrow) (score 3). Nasal turbinates of aMPV subtype-A-inoculated broilers show similar lesions.
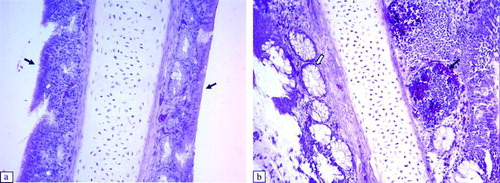
Table 1. Mean histopathological lesion scores in aMPV-inoculated and control broilers
Figure 4. Histopathological lesions of the trachea at 6 d.p.i. (H & E stain, 200x magnification). 4a: Intact ciliated epithelium of a control broiler (arrow). 4b: Trachea of an aMPV subtype-A-inoculated broiler with thickening due to oedema and infiltration of inflammatory cells in the epithelium (black arrow) and focal exfoliation (white arrow) (score 2). Tracheae of aMPV subtype-A-inoculated broilers show similar lesions.
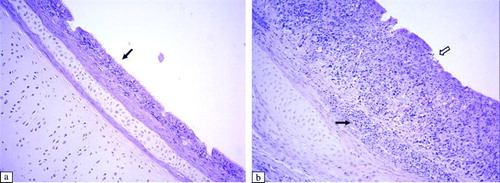
Figure 5. Histopathological lesions of the infraorbital sinus epithelium at 6 d.p.i. (H & E stain, 100x magnification). 5a: Control group. 5b: Infraorbital sinus epithelium of an aMPV subtype-B-inoculated broiler showing infiltration of lymphoid cells (black arrow) and destruction of the epithelium (white arrow). Infraorbital sinus epithelium of an aMPV subtype-A-inoculated broiler shows similar lesions.
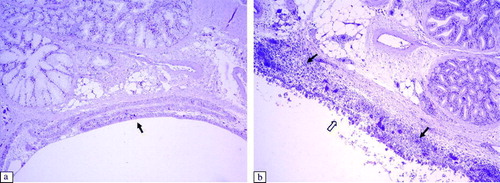
Figure 6. Histopathological lesions of the secondary bronchi of the lung, at 6 d.p.i. (H & E stain, 100x magnification). 6a: Control group. 6b: Secondary bronchi of an aMPV subtype-B-inoculated broilers showing formation of lymphoid follicles in the submucosa (arrows). Secondary bronchi of an aMPV subtype-A-inoculated broiler show a similar lesion.
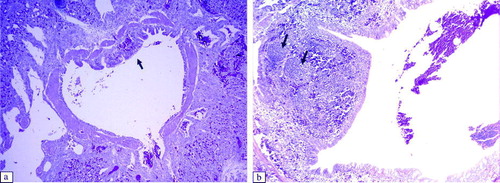
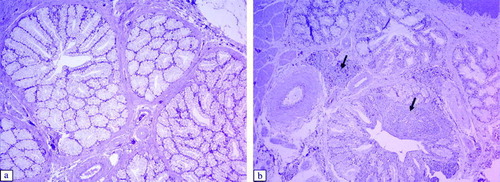
Figure 7. Histopathological lesions of the Harderian gland at 6 d.p.i. (H & E stain, 200x magnification). 7a: Control group. 7b: Harderian gland of an aMPV subtype-B-inoculated broiler showing infiltration of lymphocytes and lymphoid follicles around the secondary collecting duct (arrows). The Harderian gland of an aMPV subtype-A-inoculated broiler shows a similar lesion.
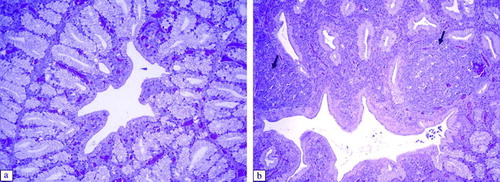
Figure 8. Histopathological lesions of the lachrymal gland at 6 d.p.i. (H & E stain, 100x magnification). 8a: Control group. 8b: Lachrymal gland of an aMPV subtype-B-inoculated broiler showing infiltration of lymphoid cells in the interstitial tissues and interlobular tissues (arrows). Lachrymal glands of an aMPV subtype-A-inoculated broiler show similar lesions.