2,103
Views
63
CrossRef citations to date
0
Altmetric
ORIGINAL ARTICLES

Pathogenicity and growth characteristics of selected infectious laryngotracheitis virus strains from the United States

, , , &
Pages 47-53 | Received 08 Jun 2008, Published online: 23 Jan 2009

Figures & data

Figure 1. Total clinical sign scores recorded daily for chickens infected with (1a) isolates IV-A and IV-B, (1b) isolates V-A and V-B, and (1c) isolates VI-A and VI-B as compared with clinical signs induced by the CEO vaccine.
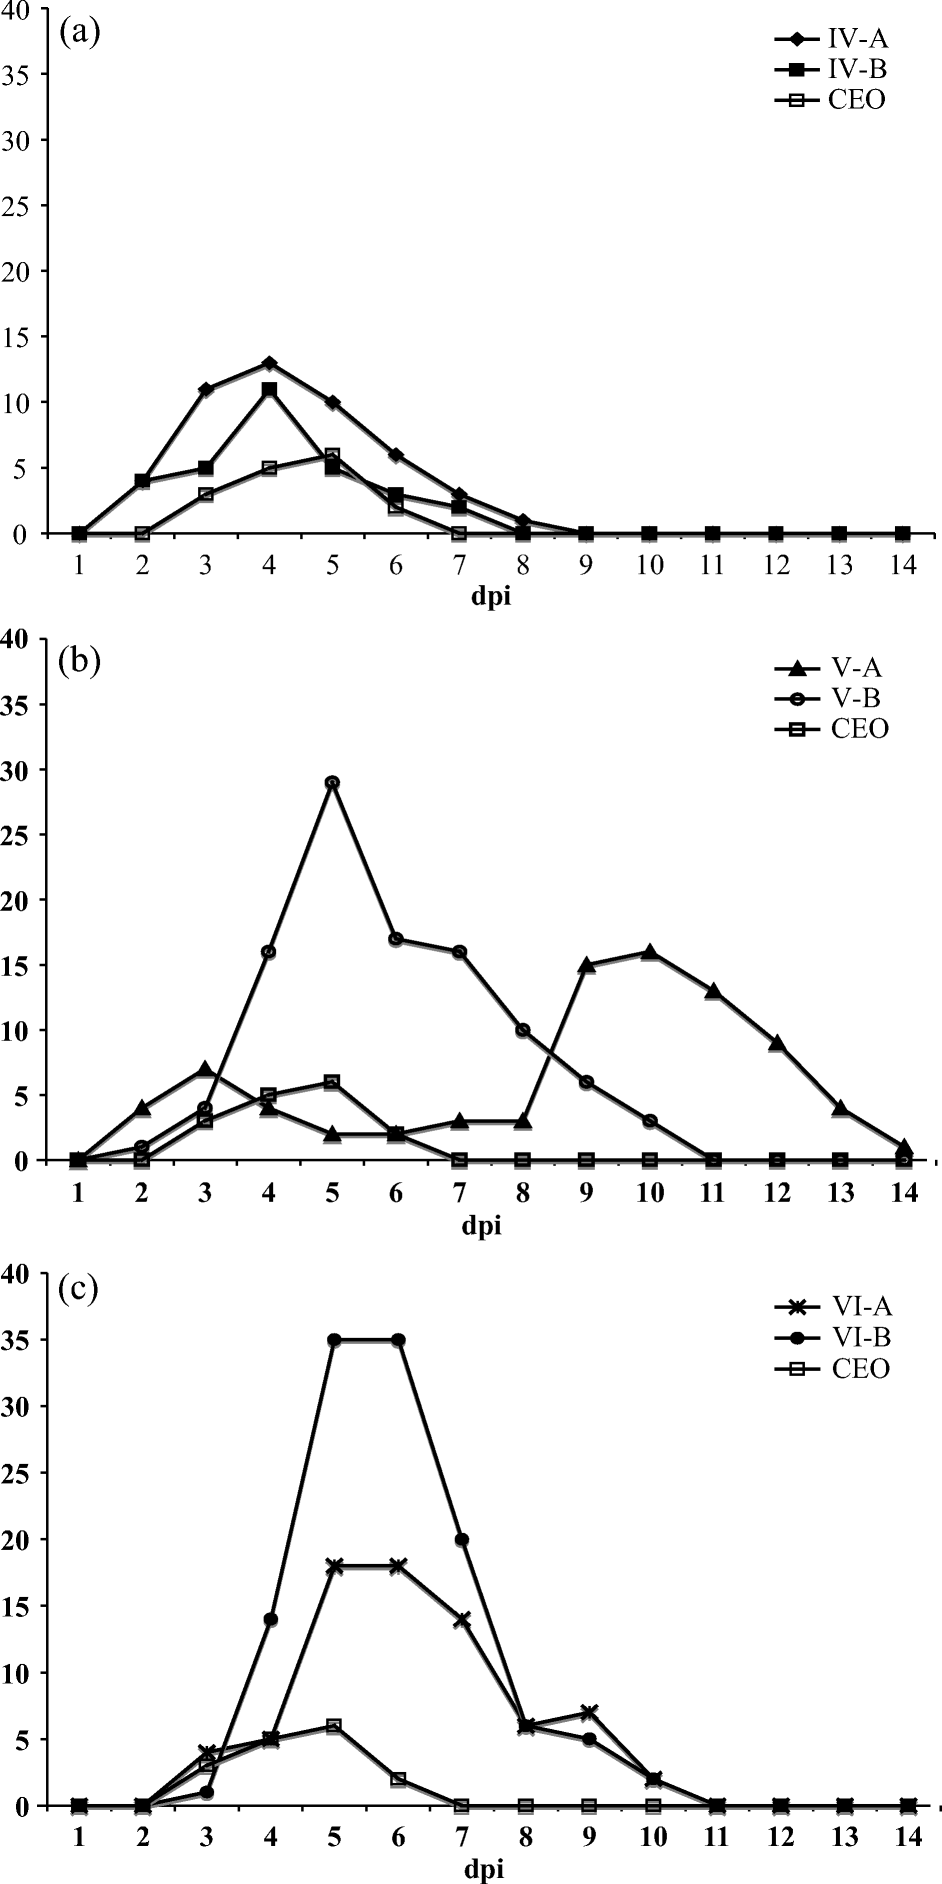
Figure 1.  Total clinical sign scores recorded daily for chickens infected with (1a) isolates IV-A and IV-B, (1b) isolates V-A and V-B, and (1c) isolates VI-A and VI-B as compared with clinical signs induced by the CEO vaccine.

Figure 2. Average GCN log10 value detected per sample by ReTi-PCR (quantitative PCR). (2a) Conjunctiva, (2b) sinuses and (2c) trachea of chickens inoculated with isolates IV-A, IV-B, V-A, V-B, VI-A and VI-B and CEO vaccine.
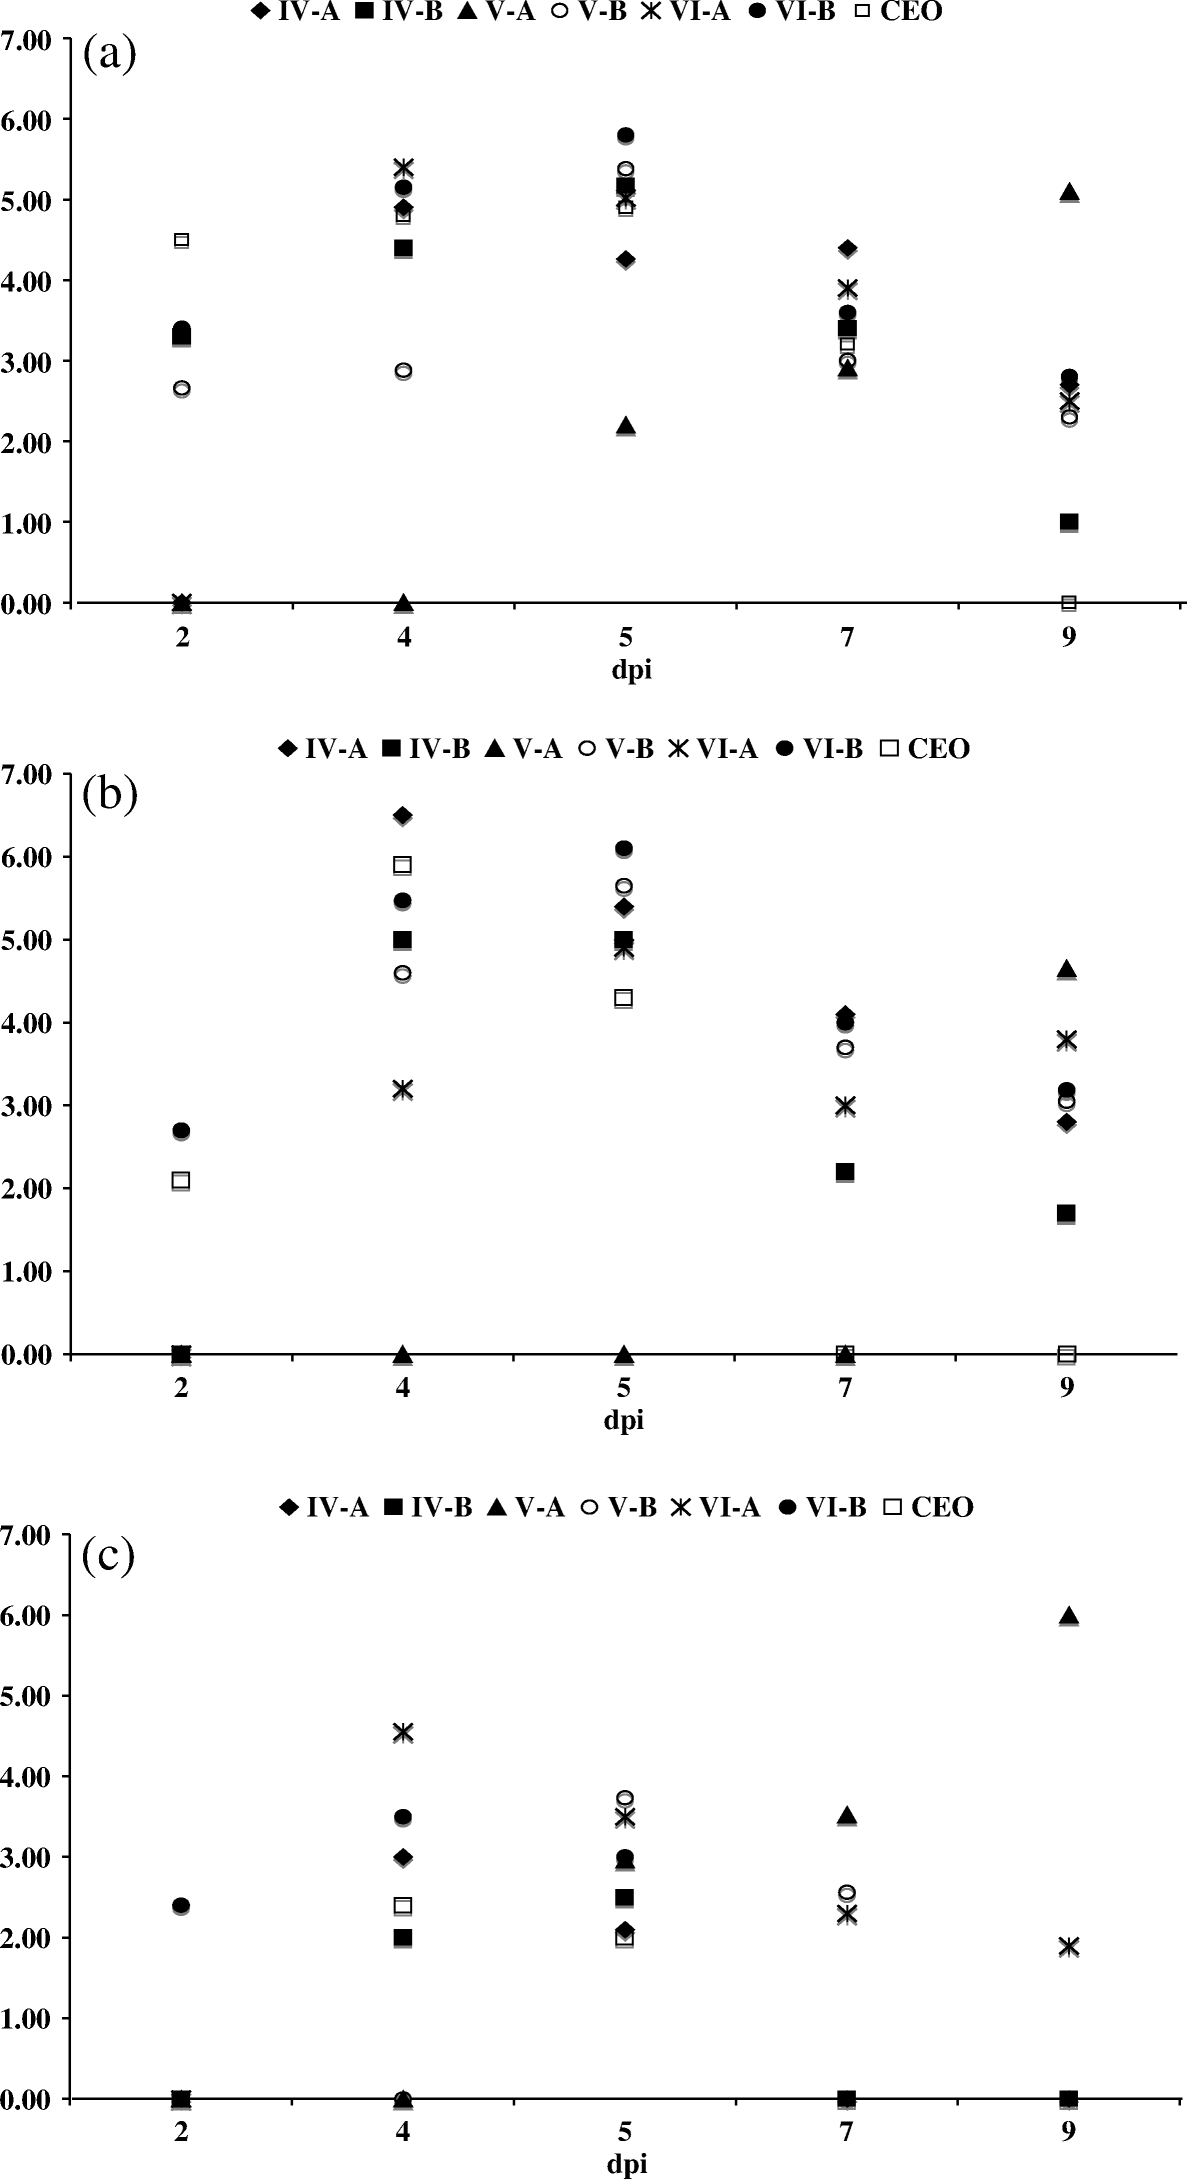
Figure 2.  Average GCN log10 value detected per sample by ReTi-PCR (quantitative PCR). (2a) Conjunctiva, (2b) sinuses and (2c) trachea of chickens inoculated with isolates IV-A, IV-B, V-A, V-B, VI-A and VI-B and CEO vaccine.

Figure 3. Average GCN log10 value detected per sample by ReTi-PCR (quantitative PCR). (3a) Trigeminal ganglia (TG) thymus (TH) and (3b) caecal tonsils (To) and cloaca (Cl) of chickens inoculated with isolates IV-A, IV-B, V-A, V-B, VI-A and VI-B and CEO vaccine.
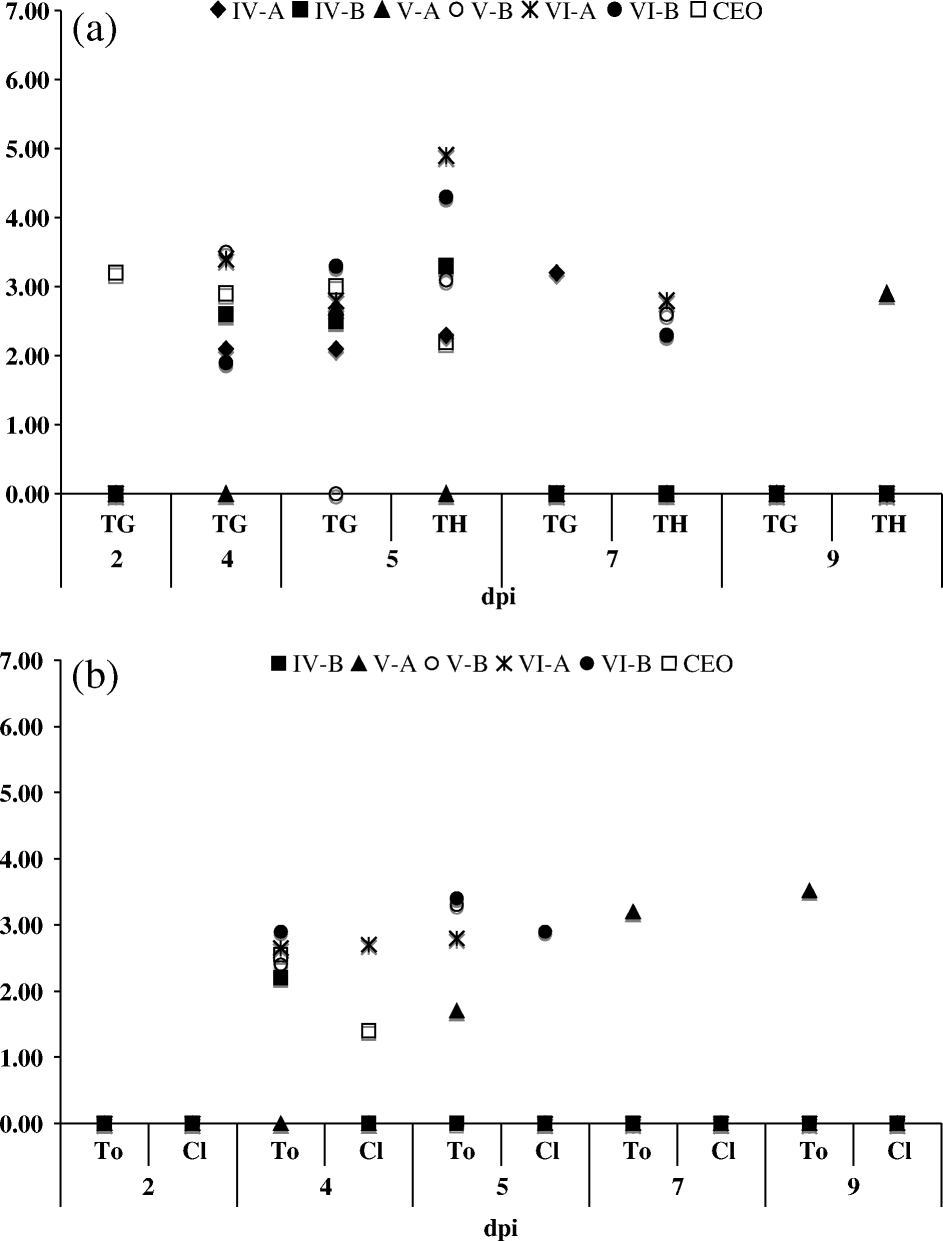
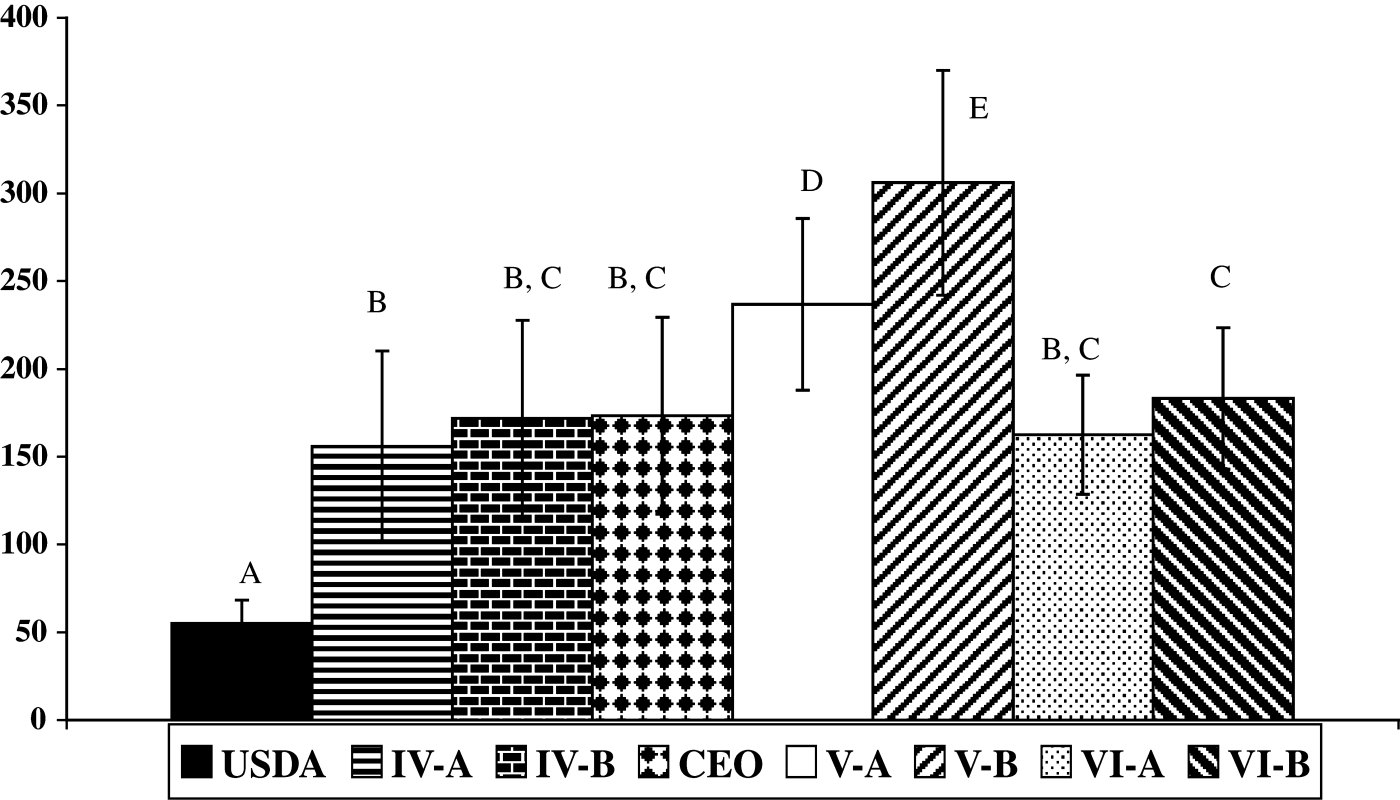
Figure 3.  Average GCN log10 value detected per sample by ReTi-PCR (quantitative PCR). (3a) Trigeminal ganglia (TG) thymus (TH) and (3b) caecal tonsils (To) and cloaca (Cl) of chickens inoculated with isolates IV-A, IV-B, V-A, V-B, VI-A and VI-B and CEO vaccine.

Table 1.  Virus isolation results on adult CK cells

Figure 4. Average plaque diameter in LMH cells for ILTV isolates. The average diameters in micrometers of 100 plaques±standard deviation was calculated for each isolate, CEO vaccine, and the USDA strain. Different uppercase letters represent significant size differences at P ≤ 0.05.

Figure 4.  Average plaque diameter in LMH cells for ILTV isolates. The average diameters in micrometers of 100 plaques±standard deviation was calculated for each isolate, CEO vaccine, and the USDA strain. Different uppercase letters represent significant size differences at P ≤ 0.05.

Reprints and Corporate Permissions

Please note: Selecting permissions does not provide access to the full text of the article, please see our help page How do I view content?

To request a reprint or corporate permissions for this article, please click on the relevant link below:

Academic Permissions

Please note: Selecting permissions does not provide access to the full text of the article, please see our help page How do I view content?

Obtain permissions instantly via Rightslink by clicking on the button below:

If you are unable to obtain permissions via Rightslink, please complete and submit this Permissions form. For more information, please visit our Permissions help page.