Figures & data
Figure 1. Histological characteristics of the different zones of tibia growth plate 4 days after feeding the thiram-containing diet. (Bar=200 µm.) P, proliferative zone; PH, prehypertrophic zone; H, hypertrophic zone. The growth plate of the thiram diet-fed chicken was thickened significantly.
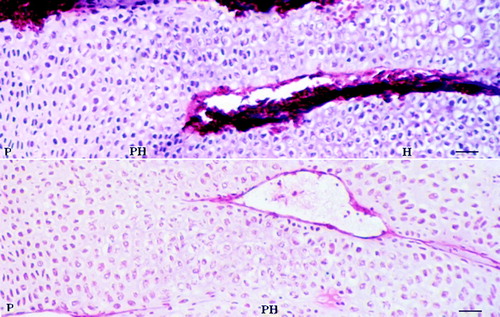
Table 1. Primers used in real-time PCR analysis
Table 2. Up-regulated genes and down-regulated genes isolated by SSH and dot blot analysisa
Figure 2. Analysis of the genes differentially expressed in growth plates. The levels of mRNA transcripts for 10 genes were determined by real-time PCR. Relative quantification of gene amplification was performed using the Ct values. Statistical differences were analysed by Student t test. *P<0.05, significant; **P<0.01, very significant.
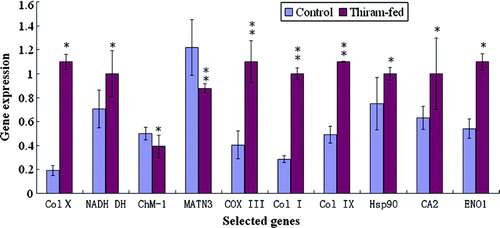
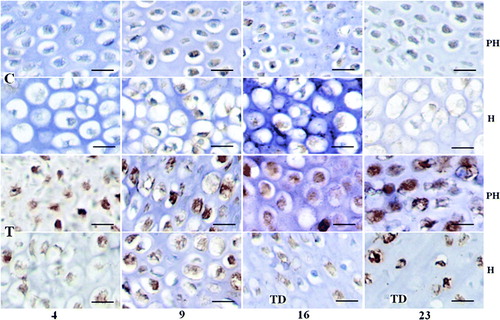
Figure 3. Expression changes of Col I in control and thiram-fed chicken growth plates at different stages. (Bar=100 µm.) Col I mainly lies in the prehypertrophic and hypertrophic zones with brown colour, but increased Col I was detected in the thiram-fed chicken growth plate on days 4, 9, 16 and 23 or around the TD lesion at the 16th and 23rd days. C, control; T, thiram-fed; PH, prehypertrophic zone; H, hypertrophic zone.
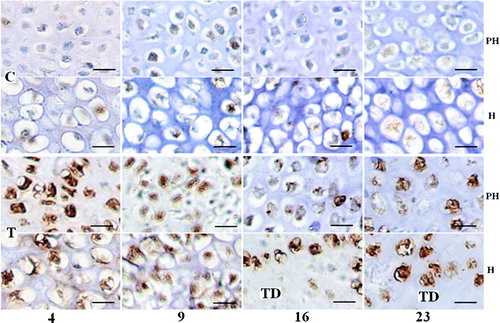
Figure 4. Expression changes of Hsp90 in control and thiram-fed chicken growth plates at different stages. (Bar=100 µm.) Hsp90 mainly lies in the prehypertrophic and hypertrophic zones with brown colour, but increased Hsp90 was detected in the thiram-fed chicken growth plate on days 4 and 9, and especially at days 16 and 23 or around the TD lesion at the 16th and 23rd days. C, control; T, thiram fed; PH, prehypertrophic zone; H, hypertrophic zone.