3,673
Views
55
CrossRef citations to date
0
Altmetric
ORIGINAL ARTICLES

Investigation into the aetiology of runting and stunting syndrome in chickens

, , , , , , & show all
Pages 41-50 | Received 13 Aug 2011, Accepted 05 Sep 2011, Published online: 16 Feb 2012

Figures & data

Table 1.  Oligonucleotides used for amplification of the sequences for the RNA probes.

Figure 1. Weight gain and presence of cystic lesions in RSS-afffected chickens. Commercial broiler chickens were exposed either to RSS-contaminated litter (RSS) or to fresh wood shavings (control). 1a: Five chickens at day 1 through day 11 and 30 chickens at day 12 after infection (day p.i.) were euthanized and the body weights were determined. The average body weights for each day is shown as a white line in the RSS-related box, and a black line in the white box representing the control chickens. In addition, the recorded minimum and maximum weights within the group were shown. *Statistically significant different values between control birds and RSS-exposed birds. 1b: The cross-section of each duodenal loop was assessed for the presence of cystic lesions for each chicken as described under (1a). The average value for the number of cystic lesions is shown for each day in the box as a white line. The minimum and maximum observed numbers of lesions were indicated. 1c: The body weight and number of cystic lesions in the duodenal loop for each chicken at days 4, 5, and 6 after exposure to the RSS-contaminated litter was shown. Body weight and cystic lesions are both plotted on the y axis.
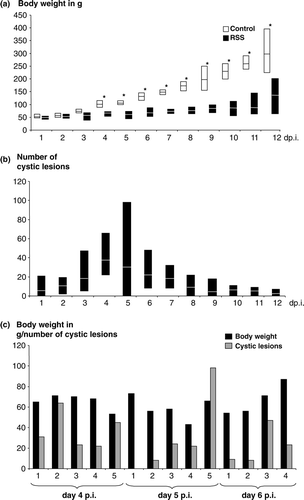
Figure 1.  Weight gain and presence of cystic lesions in RSS-afffected chickens. Commercial broiler chickens were exposed either to RSS-contaminated litter (RSS) or to fresh wood shavings (control). 1a: Five chickens at day 1 through day 11 and 30 chickens at day 12 after infection (day p.i.) were euthanized and the body weights were determined. The average body weights for each day is shown as a white line in the RSS-related box, and a black line in the white box representing the control chickens. In addition, the recorded minimum and maximum weights within the group were shown. *Statistically significant different values between control birds and RSS-exposed birds. 1b: The cross-section of each duodenal loop was assessed for the presence of cystic lesions for each chicken as described under (1a). The average value for the number of cystic lesions is shown for each day in the box as a white line. The minimum and maximum observed numbers of lesions were indicated. 1c: The body weight and number of cystic lesions in the duodenal loop for each chicken at days 4, 5, and 6 after exposure to the RSS-contaminated litter was shown. Body weight and cystic lesions are both plotted on the y axis.

Table 2.  Average scores of microscopic changes in the bursa of Fabricius, thymus, and Harderian gland.

Figure 2. Astrovirus RNA was detected in epithelial cells of RSS-exposed chickens. 2a: Sections from the duodenal loop of commercial broiler chickens exposed either to RSS-contaminated litter (RSS) or chickens exposed to fresh wood shavings (control) were exposed to antisense DIG-labelled riboprobes specific to a chicken astrovirus (CAstV), ANV-1, ANV-2, and a chicken parvovirus (ChPV). Selected areas (asterisks) of RSS-infected chickens are shown inset. Bar in picture of lower magnification = 100 mm; bar in inset = 20 mm. 2b: DF-1 cells were either mock transfected (a), or transfected with a DIG-labelled sense cRNA riboprobe (b), or transfected with unlabelled sense riboprobe (c). The fixed cells of (a) and (c) were hybridized with DIG-labelled antisense riboprobe. The NBT/BCIP reagents were applied to all three samples for colorimetric detection of the DIG-labelled cRNA probe. Bar = 50 mm. Bar in inset with higher magnification = 20 mm. T, transfection; P, probe.
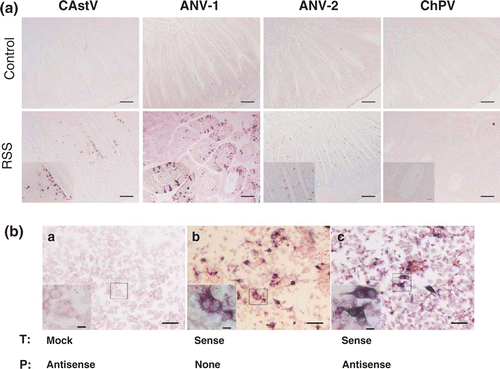
Figure 2.  Astrovirus RNA was detected in epithelial cells of RSS-exposed chickens. 2a: Sections from the duodenal loop of commercial broiler chickens exposed either to RSS-contaminated litter (RSS) or chickens exposed to fresh wood shavings (control) were exposed to antisense DIG-labelled riboprobes specific to a chicken astrovirus (CAstV), ANV-1, ANV-2, and a chicken parvovirus (ChPV). Selected areas (asterisks) of RSS-infected chickens are shown inset. Bar in picture of lower magnification = 100 mm; bar in inset = 20 mm. 2b: DF-1 cells were either mock transfected (a), or transfected with a DIG-labelled sense cRNA riboprobe (b), or transfected with unlabelled sense riboprobe (c). The fixed cells of (a) and (c) were hybridized with DIG-labelled antisense riboprobe. The NBT/BCIP reagents were applied to all three samples for colorimetric detection of the DIG-labelled cRNA probe. Bar = 50 mm. Bar in inset with higher magnification = 20 mm. T, transfection; P, probe.

Figure 3. Presence of viral RNA specific for astroviruses during exposure to RSS-contaminated litter. Sections from the duodenal loop of commercial broiler chickens exposed either to RSS-contaminated litter (RSS) or to fresh wood shavings (control) were exposed to antisense DIG-labelled riboprobes specific to a chicken astrovirus (CAstV), ANV-1, and ANV-2 were scored for the presence of an ISH signal on an individual basis during the first 5 days after exposure (day p.i.). The presence of cystic lesions per cross-section is indicated (+). The ISH score was estimated on the basis of the following scale: 0 = no signals; 1 = < 5 signals per high-power field; 2 = five to 15 signals per high-power field; 3 = > 5 signals per high-power field.
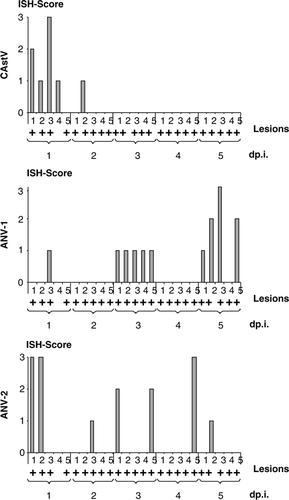
Figure 3.  Presence of viral RNA specific for astroviruses during exposure to RSS-contaminated litter. Sections from the duodenal loop of commercial broiler chickens exposed either to RSS-contaminated litter (RSS) or to fresh wood shavings (control) were exposed to antisense DIG-labelled riboprobes specific to a chicken astrovirus (CAstV), ANV-1, and ANV-2 were scored for the presence of an ISH signal on an individual basis during the first 5 days after exposure (day p.i.). The presence of cystic lesions per cross-section is indicated (+). The ISH score was estimated on the basis of the following scale: 0 = no signals; 1 = < 5 signals per high-power field; 2 = five to 15 signals per high-power field; 3 = > 5 signals per high-power field.

Reprints and Corporate Permissions

Please note: Selecting permissions does not provide access to the full text of the article, please see our help page How do I view content?

To request a reprint or corporate permissions for this article, please click on the relevant link below:

Academic Permissions

Please note: Selecting permissions does not provide access to the full text of the article, please see our help page How do I view content?

Obtain permissions instantly via Rightslink by clicking on the button below:

If you are unable to obtain permissions via Rightslink, please complete and submit this Permissions form. For more information, please visit our Permissions help page.