1,582
Views
35
CrossRef citations to date
0
Altmetric
ORIGINAL ARTICLES

Challenges for accurate and prompt molecular diagnosis of clades of highly pathogenic avian influenza H5N1 viruses emerging in Vietnam

, , , , , , , , , , & show all
Pages 177-193 | Received 07 Jun 2011, Accepted 06 Nov 2011, Published online: 19 Apr 2012

Figures & data

Table 1.  Description of four H5N1 HPAI-infected Vietnamese poultry flocks sampled in 2009.

Figure 1. Distribution of Ct values for different types of clinical specimens from chickens tested by both M-gene RRT-PCRs and the H5 HA2 RRT-PCR. Specimens from all 46 chickens included (a) tracheal swabs, (b) cloacal swabs and (c) feathers. Ct values (vertical axis) for M gene ‘wet’ and ‘bead’ RRT PCR results are shown by diamond and square symbols respectively, H5 HA2 RRT PCR Ct values are shown by triangles. Filled symbols indicate chicken specimens that were tested by VI, where dot and grey fills indicate VI positive and VI negative results respectively. The total numbers of “No Ct” results for each RRT PCR are stated above the corresponding test, with parentheses indicating numbers of VI negative and positive results by a and b respectively. Numbers of indeterminate RRT PCR results (Ct 36.01–39.99) are also stated above each graph (broken horizontal line indicates Ct 36), while numbers of positive RRT PCR results are stated beneath each graph for the corresponding test. The range of Ct values are listed for the positive results for the corresponding RRT PCR.
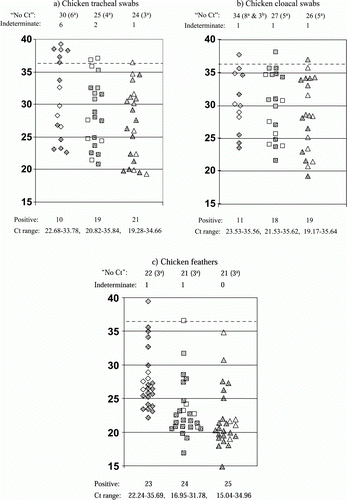
Figure 1.  Distribution of Ct values for different types of clinical specimens from chickens tested by both M-gene RRT-PCRs and the H5 HA2 RRT-PCR. Specimens from all 46 chickens included (a) tracheal swabs, (b) cloacal swabs and (c) feathers. Ct values (vertical axis) for M gene ‘wet’ and ‘bead’ RRT PCR results are shown by diamond and square symbols respectively, H5 HA2 RRT PCR Ct values are shown by triangles. Filled symbols indicate chicken specimens that were tested by VI, where dot and grey fills indicate VI positive and VI negative results respectively. The total numbers of “No Ct” results for each RRT PCR are stated above the corresponding test, with parentheses indicating numbers of VI negative and positive results by a and b respectively. Numbers of indeterminate RRT PCR results (Ct 36.01–39.99) are also stated above each graph (broken horizontal line indicates Ct 36), while numbers of positive RRT PCR results are stated beneath each graph for the corresponding test. The range of Ct values are listed for the positive results for the corresponding RRT PCR.

Figure 2. Distribution of Ct values for different types of clinical specimens from ducks tested by both M-gene RRT-PCRs and the H5 HA2 RRT-PCR. Specimens from all 48 ducks included (a) tracheal swabs, (b) cloacal swabs and (c) feathers. All were tested by the three RRT PCRs described in Fig 1, and details are as explained in the footnote to the preceding figure. Fig 2 includes VI results for 32 duck specimens.
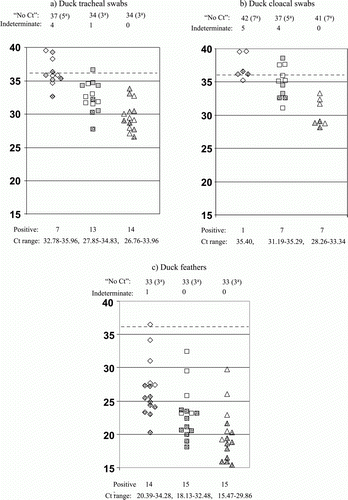
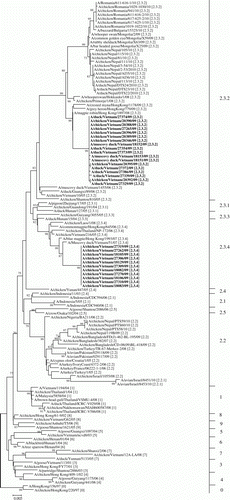
Figure 2.  Distribution of Ct values for different types of clinical specimens from ducks tested by both M-gene RRT-PCRs and the H5 HA2 RRT-PCR. Specimens from all 48 ducks included (a) tracheal swabs, (b) cloacal swabs and (c) feathers. All were tested by the three RRT PCRs described in Fig 1, and details are as explained in the footnote to the preceding figure. Fig 2 includes VI results for 32 duck specimens.
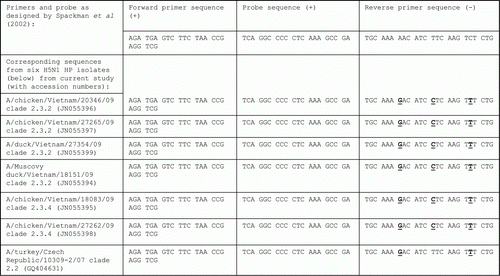
Table 2.  Sensitivity of RRT-PCR testing of each of the three clinical specimens to identify an infected bird.

Table 3.  Results from a Bayesian model to estimate the sensitivities of the three main AI RRT-PCRs.

Table 4.  VI sensitivity determined by the numbers of successful isolates relative to the numbers of bird-level AI RRT-PCR-diagnosed infected animals.

Figure 3. Phylogenetic analysis of the HA gene of 125 H5N1 HPAI isolates.

Figure 3.  Phylogenetic analysis of the HA gene of 125 H5N1 HPAI isolates.

Figure 4. M-gene RRT-PCR primer and probe binding sequences.

Figure 4.  M-gene RRT-PCR primer and probe binding sequences.

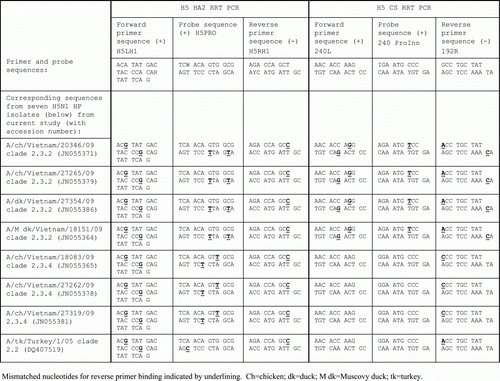
Figure 5. Primer and probe binding sequences for H5 HA2 and CS RRT-PCRs.

Figure 5.  Primer and probe binding sequences for H5 HA2 and CS RRT-PCRs.

Table 5.  Comparison of the H5 CS and H5 HA2 RRT-PCRs among the H5N1 HPAI-infected chickens (n = 26) and ducks (n = 15).

Table S1.  Accession numbers of sequenced genes and virus isolates.

Table S2.  Bird-level diagnosis of AI infection by a positive result on a clinical specimen(s) by at least one of the two M-gene and the H5 HA2 RRT-PCRs.

Table S3.  M-gene RRT-PCR Ct values for the chicken specimens that were tested by VI.

Table S4.  M-gene RRT-PCR Ct values for the duck specimens that were tested by VI.

Reprints and Corporate Permissions

Please note: Selecting permissions does not provide access to the full text of the article, please see our help page How do I view content?

To request a reprint or corporate permissions for this article, please click on the relevant link below:

Academic Permissions

Please note: Selecting permissions does not provide access to the full text of the article, please see our help page How do I view content?

Obtain permissions instantly via Rightslink by clicking on the button below:

If you are unable to obtain permissions via Rightslink, please complete and submit this Permissions form. For more information, please visit our Permissions help page.