1,756
Views
16
CrossRef citations to date
0
Altmetric
ORIGINAL ARTICLES

Demonstration of Ornithobacterium rhinotracheale in pheasants (Phasianus colchicus) with pneumonia and airsacculitis

, , , , , , , , & show all
Pages 171-178 | Received 23 Aug 2012, Accepted 14 Dec 2012, Published online: 14 Apr 2013

Figures & data

Figure 1. Parallel FISH (left side) and haematoxylin and eosin (H & E; right side) stained images of lung tissue from affected pheasants. The FISH images show ORT in red (arrowhead) and other bacteria in green (arrow) in the lumen of the bronchi (1a to 1d) with cellular debris. 1a: Case B210-12 Bird 4. 1b: Case B293-2 Bird 4. 1c: Case B293-2 Bird 6. 1d: Case B293-2 Bird 4. The H & E images of the same tissues show cellular debris and red blood cells in the lumen and in (1c) inflammatory cell infiltration of the lung parenchyma adjacent to the bronchus. Bar = 100 µm.
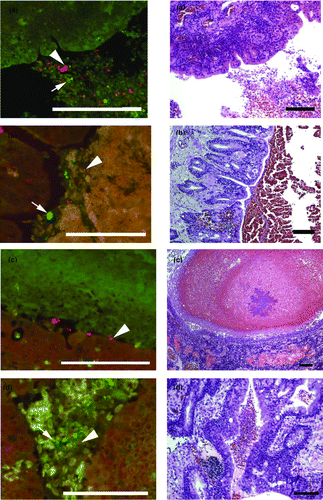
Figure 1.  Parallel FISH (left side) and haematoxylin and eosin (H & E; right side) stained images of lung tissue from affected pheasants. The FISH images show ORT in red (arrowhead) and other bacteria in green (arrow) in the lumen of the bronchi (1a to 1d) with cellular debris. 1a: Case B210-12 Bird 4. 1b: Case B293-2 Bird 4. 1c: Case B293-2 Bird 6. 1d: Case B293-2 Bird 4. The H & E images of the same tissues show cellular debris and red blood cells in the lumen and in (1c) inflammatory cell infiltration of the lung parenchyma adjacent to the bronchus. Bar = 100 µm.

Figure 2. Phylogenetic analysis of 16S rRNA sequences of ORT isolates examined in this study in comparison with strains described previously (Amonsin et al., Citation1997). Bar = 0.0005 substitutions per nucleotide position.
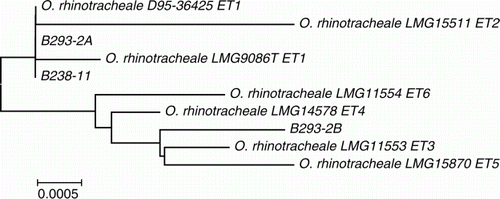
Figure 2.  Phylogenetic analysis of 16S rRNA sequences of ORT isolates examined in this study in comparison with strains described previously (Amonsin et al., Citation1997). Bar = 0.0005 substitutions per nucleotide position.

Figure 3. Phylogenetic tree based on 1721 nucleotides of the haemagglutinin-neuraminidase gene from four APMV-2 viruses. The evolutionary history was inferred using the neighbour-joining method (Saitou & Nei, Citation1987). The percentage of replicate trees in which the associated taxa clustered together in the bootstrap test (1000 replicates) is shown next to the branches. The evolutionary distances were computed using the Tamura three-parameter method and evolutionary analyses were conducted in MEGA5. Bar = 0.05 substitutions per nucleotide position.

Figure 3.  Phylogenetic tree based on 1721 nucleotides of the haemagglutinin-neuraminidase gene from four APMV-2 viruses. The evolutionary history was inferred using the neighbour-joining method (Saitou & Nei, Citation1987). The percentage of replicate trees in which the associated taxa clustered together in the bootstrap test (1000 replicates) is shown next to the branches. The evolutionary distances were computed using the Tamura three-parameter method and evolutionary analyses were conducted in MEGA5. Bar = 0.05 substitutions per nucleotide position.

Reprints and Corporate Permissions

Please note: Selecting permissions does not provide access to the full text of the article, please see our help page How do I view content?

To request a reprint or corporate permissions for this article, please click on the relevant link below:

Academic Permissions

Please note: Selecting permissions does not provide access to the full text of the article, please see our help page How do I view content?

Obtain permissions instantly via Rightslink by clicking on the button below:

If you are unable to obtain permissions via Rightslink, please complete and submit this Permissions form. For more information, please visit our Permissions help page.