1,103
Views
8
CrossRef citations to date
0
Altmetric
ORIGINAL ARTICLES

Vaccination-challenge interval markedly influences protection provided by Rispens CVI988 vaccine against very virulent Marek's disease virus challenge

, , , &
Pages 516-526 | Received 23 Apr 2013, Accepted 26 Jul 2013, Published online: 07 Oct 2013

Figures & data

Table 1. Summary of treatments showing treatment abbreviations and vaccination challenge interval.

Table 2. Details of viruses used in the experiment.

Table 3. Effect of vaccination with Rispens CVI988 vaccine and challenge with vvMDV isolate 02LAR in various time combinations on total mortality, mortality with MD, incidence of MD to 56 d.p.c. and PI by VCI and treatment in commercial ISA Brown chickens

Figure 1. Survival patterns of commercial ISA Brown layer chickens vaccinated with Rispens CVI988 vaccine and/or challenged with MDV isolate 02LAR showing the effects of VCI ranging from −10 to 10 days (left; P < 0.0001), challenge with 02LAR in unvaccinated chickens (middle; P=0.38) and vaccination with Rispens CVI988 in unchallenged chickens (right; P<0.0001).
Figure 2. Association between vaccination challenge interval and (2a) MD incidence and (2b) PI. Each point represents an individual isolator.
Figure 3. Mean (least-squares means ± standard errors of the mean) serum Log10 of MD antibody titre for the different VCI treatments measured at 21 and 56 d.p.c. The effect of VCI was significant (P = 0.006). abcMeans columns not sharing a common superscript letter differ significantly (P < 0.05).
Figure 4. Mean (least-squares means ± standard errors of the mean) serum Log10 of MD antibody titre for all treatments measured at 21 and 56 d.p.c. for all treatments involving MDV challenge or 21 and 56 d.p.v. in the RIS treatments. The effect of treatment was significant (P = 0.0006).
Figure 5. Association between MD incidence and pathogenic MDV load in PBL at various times post infection. Each data point represents the mean Log10 MDV copy number in PBL of five chickens from each isolator and the corresponding MD incidence of that group up to 56 d.p.c. First row, unchallenged isolators excluded; second row, unchallenged and unvaccinated treatments excluded.

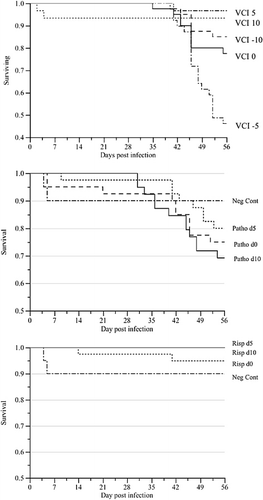
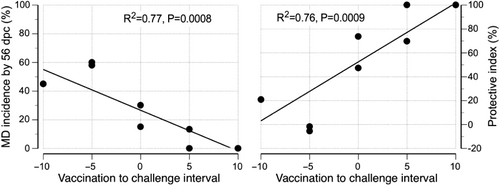
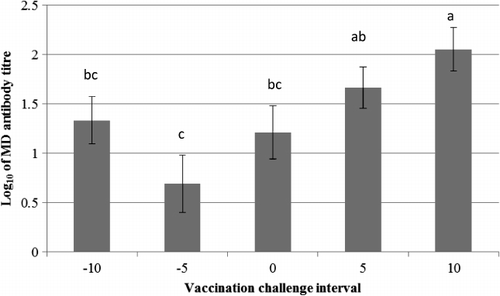
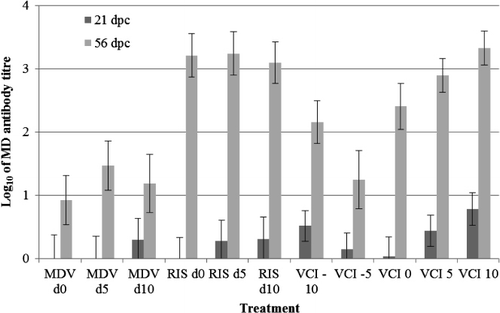
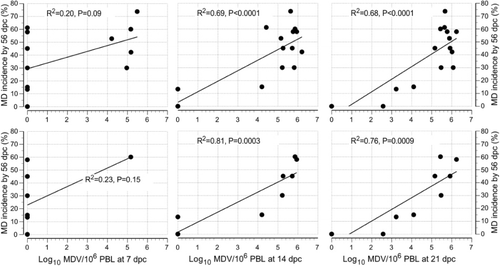
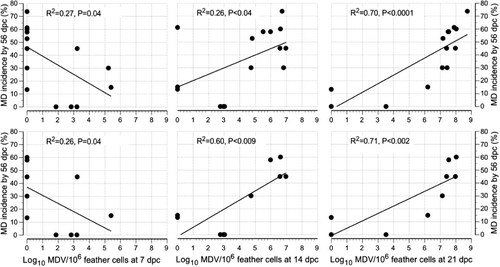
Table 4. Pairwise correlation of MD incidence (MD%) at day 56 with viral load in various tissues, immune organ weight and MD antibody titre of different challenge days.

Figure 6. Association between MD incidence and pathogenic MDV load in feather cells at various times post infection. Each data point represents the mean Log10 MDV copy number in feather cells of five chickens from each isolator and the corresponding MD incidence of that group up to 56 d.p.c. at the end of the experiment. First row, unchallenged isolators excluded; second row, unchallenged and unvaccinated treatments excluded.

Table 5. Pairwise correlation of MD incidence (MD%) at d56 with viral load in various tissues, immune organ weight and MD antibody titre of different challenge days.

Reprints and Corporate Permissions

Please note: Selecting permissions does not provide access to the full text of the article, please see our help page How do I view content?

To request a reprint or corporate permissions for this article, please click on the relevant link below:

Academic Permissions

Please note: Selecting permissions does not provide access to the full text of the article, please see our help page How do I view content?

Obtain permissions instantly via Rightslink by clicking on the button below:

If you are unable to obtain permissions via Rightslink, please complete and submit this Permissions form. For more information, please visit our Permissions help page.