1,438
Views
16
CrossRef citations to date
0
Altmetric
ORIGINAL ARTICLES

Dietary vitamin E in White Leghorn layer breeder hens: a strategy to combat aflatoxin B1-induced damage

, , , , , & show all
Pages 389-395 | Received 12 Apr 2014, Accepted 08 Jun 2014, Published online: 01 Sep 2014

Figures & data

Table 1. Egg production (%) of breeder hens kept on AFB1 contaminated feed with or without Vit E supplementation (Mean ± SD).

Table 2. Aflatoxin B1 residues (ng/g) in the eggs obtained from the breeder hens kept on AFB1 contaminated feed with or without Vit E supplementation (Mean ± SD).
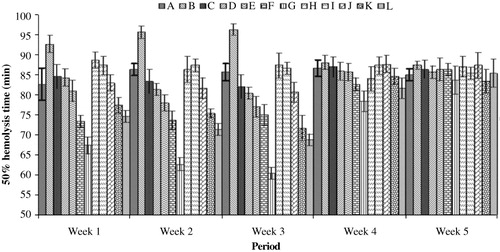
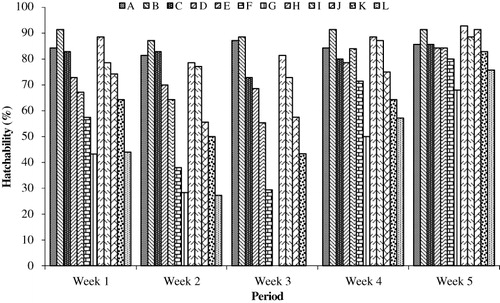
Figure 1. Comparison of rate of haemolysis. Values shown are for the time point at which 50% haemolysis was observed using the free radical generator AAPH. All values shown are with RBCs obtained from breeder hens fed AFB1 ± Vit E for 3 weeks. Values shown are mean ± standard deviation from eight hens/group. All groups (Groups A to L) were fed diets containing various amounts of AFB1 in the presence/absence of Vit E; specific exposure levels associated with each group are indicated in and . Value significantly different from control at P ≤ 0.05 are indicated.
Figure 1. Comparison of rate of haemolysis. Values shown are for the time point at which 50% haemolysis was observed using the free radical generator AAPH. All values shown are with RBCs obtained from breeder hens fed AFB1 ± Vit E for 3 weeks. Values shown are mean ± standard deviation from eight hens/group. All groups (Groups A to L) were fed diets containing various amounts of AFB1 in the presence/absence of Vit E; specific exposure levels associated with each group are indicated in Tables 1 and 2. Value significantly different from control at P ≤ 0.05 are indicated.
Figure 2. Comparison of hatchability in different groups. All values shown are the percentage of dead embryos from breeder hens fed AFB1 ± Vit E for 3 weeks. All groups (Groups A to L) were fed diets containing various amounts of AFB1 in the presence/absence of Vit E; specific exposure levels associated with each group are indicated in and .
Figure 2. Comparison of hatchability in different groups. All values shown are the percentage of dead embryos from breeder hens fed AFB1 ± Vit E for 3 weeks. All groups (Groups A to L) were fed diets containing various amounts of AFB1 in the presence/absence of Vit E; specific exposure levels associated with each group are indicated in Tables 1 and 2.
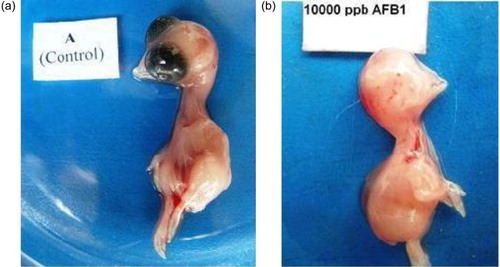
Figure 3. Embryo at 11 days of incubation from the hens: (3a) fed a diet having 0 mg kg−1 AFB1 and 0 mg kg−1 Vit E; and (3b) fed a diet amended with 10 mg AFB1 kg−1 for 3 weeks. Maxillary retrognathism, mandibular hypoplasia, and anophthalmia (bilateral) are visible.

Reprints and Corporate Permissions

Please note: Selecting permissions does not provide access to the full text of the article, please see our help page How do I view content?

To request a reprint or corporate permissions for this article, please click on the relevant link below:

Academic Permissions

Please note: Selecting permissions does not provide access to the full text of the article, please see our help page How do I view content?

Obtain permissions instantly via Rightslink by clicking on the button below:

If you are unable to obtain permissions via Rightslink, please complete and submit this Permissions form. For more information, please visit our Permissions help page.