1,490
Views
9
CrossRef citations to date
0
Altmetric
ORIGINAL ARTICLES

Characterization of two pigeon paramyxovirus type 1 isolates in China

, , , , , & show all
Pages 204-211 | Received 25 Nov 2014, Accepted 15 Feb 2015, Published online: 02 Apr 2015

Figures & data

Table 1. Experimental infection: chicken groups and viruses used.

Table 2. Details of the two PPMV-1 isolates investigated in this study.

Figure 1. Phylogenetic tree based on the nucleotide sequences of the (A) complete genome and (B) fusion gene of NDV. The phylogenetic tree was constructed using the neighbour-joining method with 1000 bootstrap replicates (bootstrap values are shown on the tree).
Figure 2. Unrooted phylogenetic tree of 70 PPMV-1 isolates based on a 374-nt section of the fusion protein gene. The tree is drawn to scale, with branch lengths proportional to the number of substitutions per site.
Figure 3. Survival rate of chickens inoculated with SD12, GM and LaSota.

Table 3. Virus shedding in cloacal swabs as indicated by RT-PCR.

Figure 4. Sero-conversion of chickens inoculated with SD12 or LaSota strains on 21 dpi.

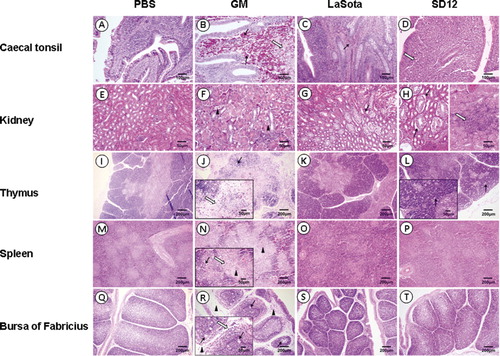
Table 4. Viral distribution in tissues of chickens inoculated with SD12, GM and LaSota.

Figure 5. Histopathology of tissues from 3-week-old chickens infected with GM, SD12 or LaSota (H&E). (A–D) Solid arrows indicate extravasated blood, and open arrows indicate necrosis of the lymphocyte. (E–H) Solid arrows indicate oedema and degeneration of the renal tubular epithelial cells, open arrows indicate lymphocytic infiltration around renal tubular area, and black triangles indicate dropout and necrosis of the renal tubular epithelial cells and tubular occlusions. (I–L) Solid arrows indicate necrosis of the lymphocyte, and open arrows indicate inflammatory cell infiltration. (M–P) Solid arrows indicate necrosis of the lymphocyte, open arrows indicate inflammatory cell infiltration, and black triangles indicate focal necrosis with neutrophil infiltration. (Q–T) Black triangles indicate atrophy of lymphoid follicle and interstitial expansion, solid arrows indicate necrosis of the lymphocyte, and open arrows indicate inflammatory cell infiltration. Scale bar = 100 μm in the caecal tonsil, 50 μm in the kidney and 200 μm in other tissues. Scale bar = 50 μm in enlarged figures J, L, N and R.
Supplemental material

Supplemental data.pdf

Download PDF (237 KB)

Reprints and Corporate Permissions

Please note: Selecting permissions does not provide access to the full text of the article, please see our help page How do I view content?

To request a reprint or corporate permissions for this article, please click on the relevant link below:

Academic Permissions

Please note: Selecting permissions does not provide access to the full text of the article, please see our help page How do I view content?

Obtain permissions instantly via Rightslink by clicking on the button below:

If you are unable to obtain permissions via Rightslink, please complete and submit this Permissions form. For more information, please visit our Permissions help page.