Figures & data
Table 1. Origin and identification of the seven Brazilian genotype IBV strains used in this study.
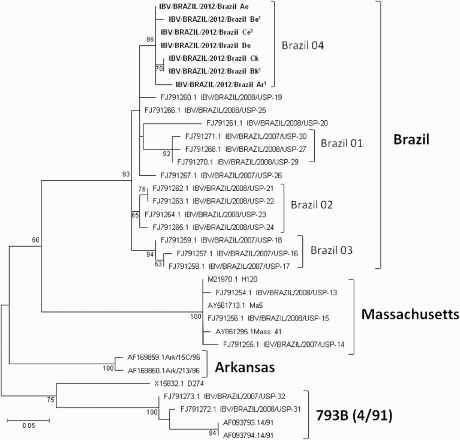
Figure 1. Amino-acids maximum likelihood tree (JTT matrix-based model, 100 bootstrap replicates) for the partial S1 subunit of the IBV spike protein (amino acid 231–346), showing the strains used in the present study (in bold) and the IBV D274, Massachusetts, 793B (4/91) and Arkansas types. The Brazilian strains used for the pathotyping and a vaccination/challenge experiment are identified with1. Numbers at each node are bootstrap values. The bar represents the number of amino-acids substitutions per site.