Figures & data
Figure 1. Ciliary activity after aMPV infection. Mean ciliary activity of aMPV-infected (a) chicken (n = 5–35) and (b) turkey (n = 5–40) TOC compared to virus-free controls at indicated times. hpi = hours post infection. Error bars indicate standard deviation. All virus-free control TOC remained at 100% ciliary activity throughout. Asterisks indicate significant differences between controls and infected TOC per timepoint (P < 0.05 student's t-test). Experiments 2 and 3 as representative experiments for chicken and turkey TOC, respectively.
Figure 2. H&E staining of histological sections. Histological staining with haematoxylin and eosin of (a)+(c)+(e) chicken and (b)+(d)+(f) turkey TOC at (a)+(b) 24 hpi, (c)+(d) 96 hpi. (e)+(f) 120 hpi. hpi = hours post infection. The pictures are representative for all three trials. Arrows: degenerated, disrupted epithelium with loss of cilia, and partially detached epithelial cell layer.
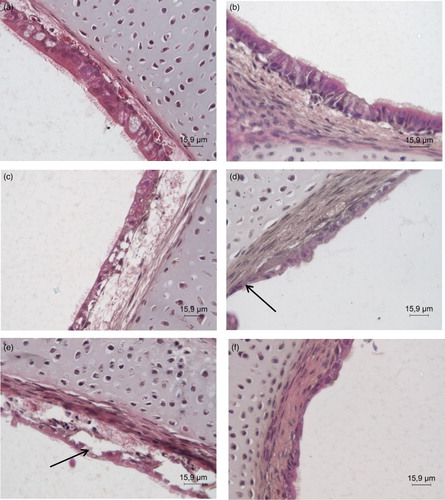
Figure 3. Average number of apoptotic cells per tracheal organ culture after aMPV infection. (a) Mean number of apoptotic cells in aMPV-infected chicken TOC (Experiment 2 as a representative experiment). n = 5/timepoint/group. hpi = hours post infection. Error bars indicate standard deviation. Asterisks indicate significant differences between controls and infected TOC per timepoint (P < 0.05 student's t-Test). (b) Detection of apoptotic cells (TUNEL assay), arrow indicates an example of an apoptotic epithelial cell of an aMPV-infected chicken TOC.
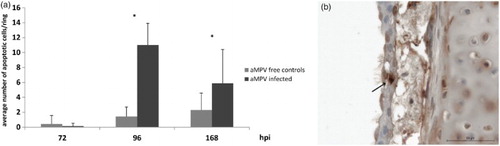
Figure 4. Immunohistochemical staining of aMPV antigen in the epithelial layer of TOC. DAB staining for aMPV-positive epithelial cells in TOC of (a)+(c)+(e) chicken and (b)+(d)+(f) turkey at (a)+(b) 24 hpi (virus-free controls), (c)+(d) 48 hpi (e)+(f) 96 hpi. hpi = hours post infection. Brown staining indicates aMPV-positive cells. The sections are representative for all trials.
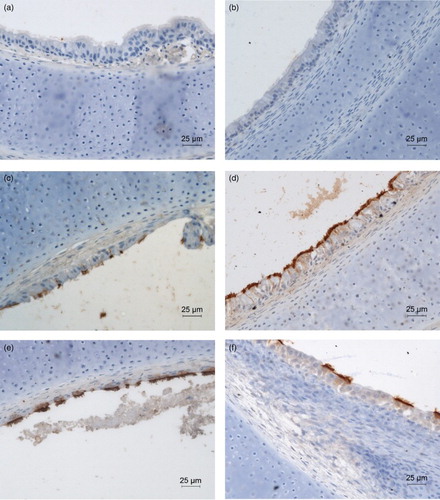
Figure 5. Average number of aMPV-positive cells in the epithelial layer of TOC. Mean number of aMPV-antigen-positive cells in aMPV-infected chicken (Experiment 2) and turkey (Experiment 3) TOC. Three microscopic fields were counted per organ culture and the mean of five cultures was calculated. Error bars indicate standard deviation. Graphs are representative for all three trials. Asterisks indicate significant differences between aMPV-infected chicken and turkey TOC per timepoint (P < 0.05 student's t-Test).
Figure 6. IFN-α mRNA expression after aMPV infection. In (a) chicken (Experiment 2) and (b) turkey (Experiment 3) TOC. Results are shown as fold change in comparison to the virus-free controls. n = 5/timepoint. Error bars indicate standard deviation. Asterisks indicate significant differences between virus-free controls and infected TOC per timepoint (P < 0.05 student's t-Test). The experiments shown are representative for all experiments.
Figure 7. iNOS mRNA expression after aMPV infection. In (a) chicken (Experiment 2) and (b) turkey (Experiment 3) TOC compared to the virus-free controls. Results are shown as fold change in comparison to the virus-free controls. n = 5. Error bars indicate standard deviation. Asterisks indicate significant differences between controls and infected TOC per timepoint (P < 0.05 student's t-Test).