Figures & data
Figure 1. Experimental time line describing the phases, pullets per cage, cage replicates and timing of measurements for two CFC modifications (0% or 40%). During the vaccination phase (days 0–30), V and CV pullets were commingled (housed together) during the brooding and growing periods. At 30 days of age, pullets were either high-dose challenged or low-dose challenged. There were seven distinct high-dose challenges with 24 pullets per challenge: E. acervulina alone; E. brunetti alone; E. maxima alone; E. necatrix alone; E. tenella alone; high-dose mix of all five Eimeria species and a sham-challenge (seven challenges × 24 pullets/challenge × three vaccine treatment groups × two CFC modifications = 1008 high-dose challenged pullets; in addition to the two cages (28 pullets per cage) of the SV, uninfected control birds; n = 1064 total). The remaining V, CV and SV pullets were all administered a low mixed dose of the five Eimeria species and housed at six birds/cage (1 challenge × 24 pullets/challenge × 3 vaccine treatment groups × 2 CFC modifications = 144 pullets). Total oocyst output was measured daily from each cage of low-dose challenged birds.
Table 1. A summary of the challenge species, the oocyst dose per pullet and the use of each Eimeria species dose in the challenge phase.
Table 2. Summary of the primer combinations, size and anneal temperatures for the polymerase chain reaction for oocyst output samples.
Figure 2. Oocyst shedding throughout the vaccination phase (0–30 days of age). The mean number of oocysts per gram of faeces from 3 to 27 DPI for Lohmann-LSL pullets administered a live Eimeria vaccine of 320 total oocysts (containing E. acervulina, E. brunetti, E. maxima, E. necatrix and E. tenella oocysts) via oral-gavage at one day of age (V, solid line) or indirectly via ingestion of vaccine progeny oocysts in the environment (CV, dotted line). Pullets were housed in conventional brooder cages without floor coverage (a, 0%), or 40% covered with chick paper (b) until 30 days of age (28 birds per cage × 14 replicates per vaccine treatment group from 1 to 14 days of age, then pullets were separated into new adjacent cages of the same treatment group at 14 birds per cage × 28 replicates for vaccine treatment groups from 14 to 30 days of age). CV pullets reared on 40% coverage had significantly higher (P ≤ 0.05) OPG compared to CV pullets reared on 0% coverage (indicated by **) from 12 to 24 DPI. V pullets reared with 40% coverage had significantly higher (P ≤ 0.05) OPG compared to V pullets reared with 0% coverage (indicated by °) from 18 to 24 DPI. All significant differences are based on natural log-transformed mean oocyst per gram of faeces and a t-statistic test was used to assess differences in mean OPG between groups on a single sample day.
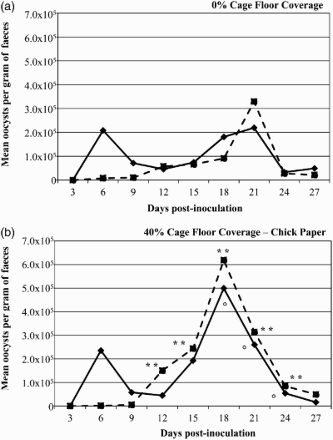
Figure 3. Total oocyst output per bird following low-dose mixed Eimeria species challenge infections (30–42 days of age). The natural log-transformed mean total oocyst output per bird (with standard error bars for the least squares means) following challenge infection with a low dose of mixed Eimeria species for each CFC and vaccine treatment combination (a total of 144 pullets). Within each bar the per cent reduction of mean total oocyst output per bird of pullets V or CV compared to the SV inoculation group within the same CFC modification is shown. Groups displaying different letters differ significantly (P ≤ 0.05) between CFC modifications within the same vaccine inoculation group (e.g. CV/0% versus CV/40%). Groups displaying different numbers differ significantly (P ≤ 0.05) between vaccine inoculation groups within the same CFC modification (e.g. CV/0% versus SV/0%).
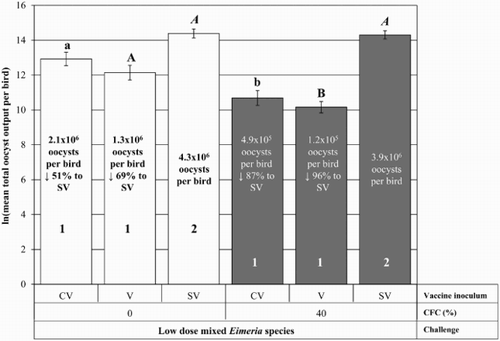
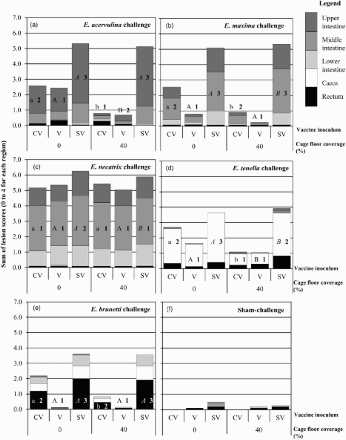
Figure 4. Lesion scores following high-dose challenges. Cumulative mean lesion scores (0–4 per region, with a maximum cumulative score of 20) for five regions of the intestinal tract (i.e. upper intestine, middle intestine, lower intestine, caeca and rectum) for each CFC and vaccine treatment (V – vaccinated; CV – contact-vaccinated; SV – sham-vaccinated) combination following high-dose challenge with the following: (a) E. acervulina; (b) E. maxima; (c) E. necatrix; (d) E. tenella; (e) E. brunetti; or, (f) sham-challenge (i.e. saline only)). Statistical significance was reported on a comparison of the reporter diagnostic region (i.e. E. acervulina – upper intestinal region; E. maxima – middle intestinal region; E. necatrix – middle intestinal region; E. tenella – caeca or E. brunetti – rectum). For each challenge, groups displaying different letters differ significantly (P ≤ 0.05) between CFC modifications within the same vaccine inoculum group (e.g. CV/0% versus CV/40%). Groups displaying different numbers differ significantly (P ≤ 0.05) between vaccine inoculum groups within the same CFC modification (e.g. CV/0% versus SV/0%).