Figures & data
Table 1. Primers used for qPCR analysis.
Figure 1. The effect of celastrol on thiram-induced TD (growth-plate width and morphology). Tibiotarsus growth plates were compared at the ages of 7 and 14 days before and after celastrol administration. Enlarged growth plate in the chicks with TD; the normal growth plate size after celastrol treatment with a decrease in growth plate width. AC, articular cartilage; GP, growth plate; TD, Tibial dyschondroplasia.
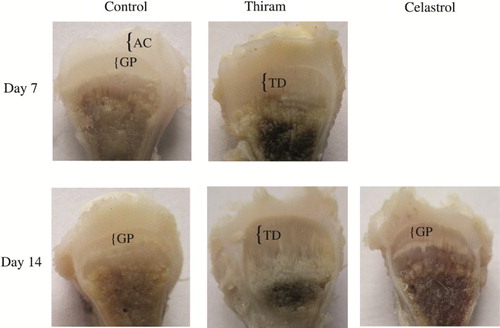
Table 2. Growth plate lesion size and TD score in control, thiram-induced and celastrol-treated groups. The results are expressed as means ± SE (n = 10).
Figure 2. Samples were collected, then tibial growth plates were stained with haematoxylin and eosin. Growth plate of TD-affected chicks was less vascularized and the columnar arrangement of the chondrocytes was lost. After celastrol administration, the columnar organization in growth plate was restored with developing blood vessels (Arrows (→) represent the BV) in the hypertrophic area (Bar = 200 µm).
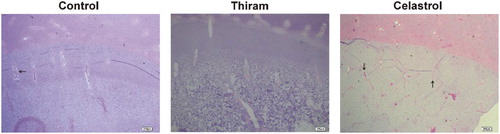
Figure 3. Effect of inhibition of Hsp90 activity with celastrol was analysed by reverse transcription qPCR on days 7 and 14 (A).Results are expressed in arbitrary units, data represent the mean ± SE (n = 4 each group). Results are shown relative to mRNA expression levels from the control group. Control group is set to one to compare the n-fold difference, letters abc indicate significant differences (P < 0.05). Western blot analysis on day 7 (B) and day 14 (C) of normal, TD-affected and celastrol treated growth plate. Western blot analysis shows the band conforming to the Hsp90 and membranes were also probed with β-actin antibody (loading control) to confirm that equal amounts of proteins were loaded; band a, control; band b, TD-affected; band c, celastrol administration.
Figure 4. Real-time quantitative PCR analysis of VEGF and FLK-1 on day 7 (a) and day 14 (b), quantification of gene amplification was done using the Ct values, all expression levels were normalized using the reference gene GAPDH. Results are shown as mean ± SE (n = 4 each group), Control group set to one thus to compare the N-fold difference. abindicate significant differences (P < 0.05).