Figures & data
Table 1. Primers used for RT-PCR analysis.
Figure 1. HE staining of broiler lungs (Bar = 20 µm). HE staining of healthy lungs (a), compared with lungs from the PH (b). (c) Bar graph showing the contradistinction of thickness between the healthy group and the PH group (**P < 0.01).
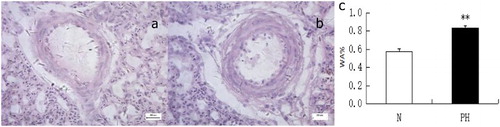
Figure 2. Immunohistochemical analysis of MIF, p-ERK and cyclinD1 in broiler lungs (Bar = 20 µm). Immunostaining with antibody to MIF, p-ERK and cyclinD1 in healthy lungs (b, e, h), compared with lungs from the PH group (c, f, i). The negative control received PBS (a, d, g).
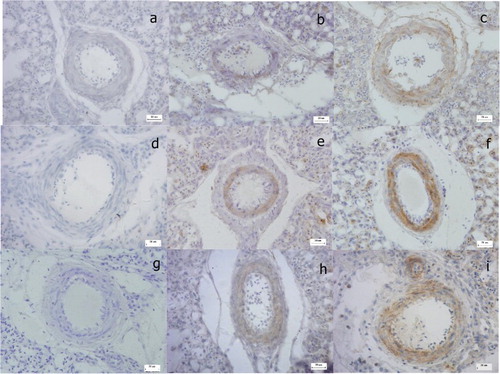
Figure 3. RT-qPCR analysis of MIF (a), ERK (b) and cyclinD1 (c) in broiler lungs (**P < 0.01). Expression levels were normalized to the levels of the geometric mean of β-actin gene expression.
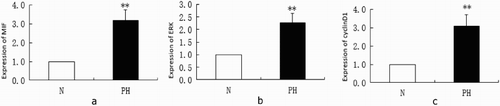
Figure 4. Immunoblot analysis of MIF, p-ERK and cyclinD1 in broiler lungs (**P < 0.01). (a) Tissue lysates were subjected to immunoblotting analysis using antibodies against MIF and β-actin (1). Bar graph showing MIF protein levels obtained from quantitative densitometry analysis (2). (b) Tissue lysates were subjected to immunoblotting analysis using antibodies against phospho-ERK (p-ERK) and total ERK (1). Bar graph showing ERK protein levels obtained from quantitative densitometry analysis (2). (c) Tissue lysates were subjected to immunoblotting analysis using antibodies against cyclinD1 and β-actin (1). Bar graph showing cyclinD1 protein levels obtained from quantitative densitometry analysis (2).
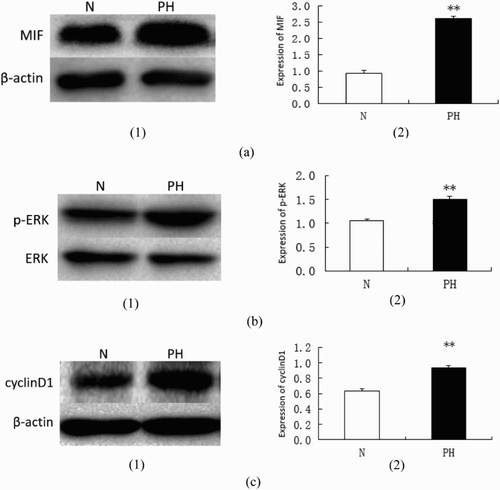
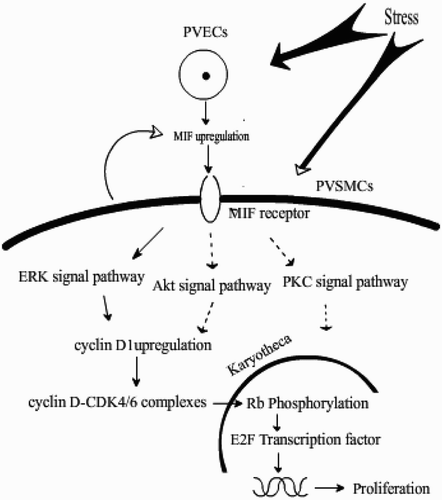
Figure 5. Schematic diagram of the mechanisms of pulmonary arterial smooth muscle proliferation.