2,195
Views
15
CrossRef citations to date
0
Altmetric
REVIEW

The route of inoculation dictates the replication patterns of the infectious laryngotracheitis virus (ILTV) pathogenic strain and chicken embryo origin (CEO) vaccine

, , , &
Pages 585-593 | Received 21 Dec 2016, Accepted 06 May 2017, Published online: 19 Jun 2017

Figures & data

Figure 1. Haematoxylin and eosin (H&E) staining of conjunctiva and trachea sections of chickens inoculated with ILTV pathogenic strain 63140 ((a,c,e,g)) or CEO vaccine strain ((b,d,f,h)) and collected at five days post-inoculation. Presence of syncytial cell formation and intranuclear inclusion bodies in the conjunctiva ((a)) and trachea ((c)) of chickens inoculated with strain 63140 via the OC route, and in the conjunctiva of chickens inoculated with the CEO strain via the OC ((b)) and IN ((f)) routes. Absence of lesions in the conjunctiva ((e)) and trachea ((g)) of 63140-inoculated chickens and in the trachea ((h)) and conjunctiva ((d)) of chickens inoculated with the CEO strain via the IN and OC routes, respectively.

Figure 1. Haematoxylin and eosin (H&E) staining of conjunctiva and trachea sections of chickens inoculated with ILTV pathogenic strain 63140 (Figure 1(a,c,e,g)) or CEO vaccine strain (Figure 1(b,d,f,h)) and collected at five days post-inoculation. Presence of syncytial cell formation and intranuclear inclusion bodies in the conjunctiva (Figure 1(a)) and trachea (Figure 1(c)) of chickens inoculated with strain 63140 via the OC route, and in the conjunctiva of chickens inoculated with the CEO strain via the OC (Figure 1(b)) and IN (Figure 1(f)) routes. Absence of lesions in the conjunctiva (Figure 1(e)) and trachea (Figure 1(g)) of 63140-inoculated chickens and in the trachea (Figure 1(h)) and conjunctiva (Figure 1(d)) of chickens inoculated with the CEO strain via the IN and OC routes, respectively.

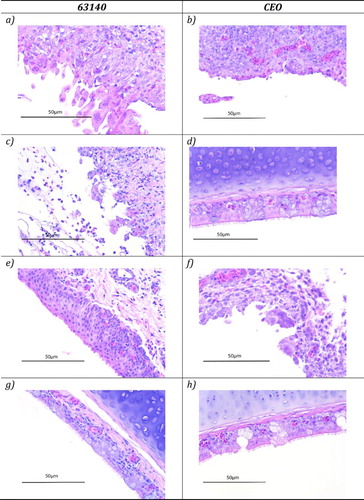
Table 1. Percentage of ILTV-positive samples as determined by histopathology examination and IHC.

Figure 2. Haematoxylin and eosin (H&E) and immunohistochemistry (IHC) staining of the Harderian gland sections collected at five days post-inoculation of chickens that received ILTV pathogenic strain 63140 or the CEO vaccine strain via the OC route. Absence of syncytial cell formation, intranuclear inclusion bodies and lymphocyte infiltration in the Harderian gland sections ((a,b)). Viral antigen detection in the Harderian gland sections ((c,d)).

Figure 2. Haematoxylin and eosin (H&E) and immunohistochemistry (IHC) staining of the Harderian gland sections collected at five days post-inoculation of chickens that received ILTV pathogenic strain 63140 or the CEO vaccine strain via the OC route. Absence of syncytial cell formation, intranuclear inclusion bodies and lymphocyte infiltration in the Harderian gland sections (Figure 2(a,b)). Viral antigen detection in the Harderian gland sections (Figure 2(c,d)).

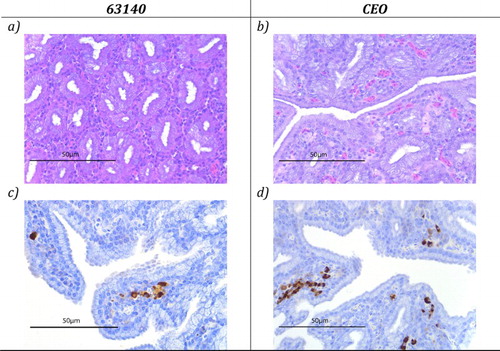
Table 2. Mean number of ILTV antigen-positive cells per Harderian gland.

Figure 3. Individual genome load of the pathogenic ILTV strain 63140 and CEO vaccine. Genome loads (Log10 2−ΔΔCt) of 63140 ((a–d)) and CEO vaccine ((e–h)) at 3 and 5 days post-inoculation. Genome loads of 63140 and CEO vaccine for each tissue were compared among groups of birds inoculated via the ocular (OC), oral (OR), intranasal (IN) or intratracheal (IT) route by the one-way analysis of variance Kruskal–Wallis test. A significant genome load decrease (P < 0.05) is indicated by a lambda symbol (λ) and a significant genome load increase (P < 0.05) is indicated by an asterisk (*). The horizontal line depicts the mean genome load per tissue and the vertical line depicts the standard deviation in the group.

Figure 3. Individual genome load of the pathogenic ILTV strain 63140 and CEO vaccine. Genome loads (Log10 2−ΔΔCt) of 63140 (Figure 3(a–d)) and CEO vaccine (Figure 3(e–h)) at 3 and 5 days post-inoculation. Genome loads of 63140 and CEO vaccine for each tissue were compared among groups of birds inoculated via the ocular (OC), oral (OR), intranasal (IN) or intratracheal (IT) route by the one-way analysis of variance Kruskal–Wallis test. A significant genome load decrease (P < 0.05) is indicated by a lambda symbol (λ) and a significant genome load increase (P < 0.05) is indicated by an asterisk (*). The horizontal line depicts the mean genome load per tissue and the vertical line depicts the standard deviation in the group.

Reprints and Corporate Permissions

Please note: Selecting permissions does not provide access to the full text of the article, please see our help page How do I view content?

To request a reprint or corporate permissions for this article, please click on the relevant link below:

Academic Permissions

Please note: Selecting permissions does not provide access to the full text of the article, please see our help page How do I view content?

Obtain permissions instantly via Rightslink by clicking on the button below:

If you are unable to obtain permissions via Rightslink, please complete and submit this Permissions form. For more information, please visit our Permissions help page.