Figures & data
Table 1. Complete blood count done on admission of an emu (index case) with progressive neurologic disease due to MPS IIIB.
Table 2. Serum biochemistry panel on admission of an emu (index case) with progressive neurologic disease due to MPS IIIB.
Figure 1. Histopathology of emus with MPS IIIB compared to an age-matched control. (A) Emu 3, brain, normal neurons. This emu was euthanized following fracture of the spine. HE. (B) Emu 2, sibling to index case, MPS IIIB, brain. Swollen neurons, Nissl substance crowded around nuclei, and cytoplasm filled with pale staining inclusions are typical of a lysosomal storage disease. HE. (C) Emu 1, index case, MPS IIIB, brain. Cytoplasmic inclusions are moderately stained with periodic acid – Schiff. (D) Emu 1, index case, MPS IIIB, brain. Cytoplasmic inclusions stain weakly with LFB.
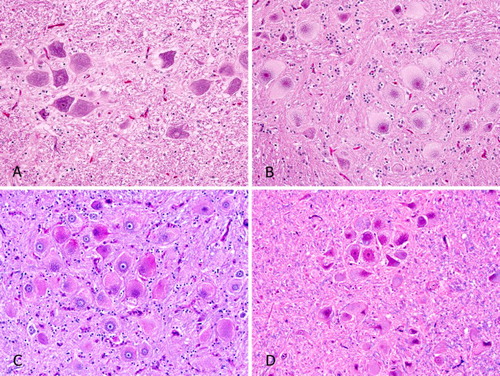
Figure 2. (A) Emu 2, sibling to index case, MPS IIIB, liver. Numerous focal aggregates of foamy macrophages are randomly scattered throughout the liver. (B) Emu 2, sibling to index case, MPS IIIB, spleen. Occasional foci of foamy macrophages like those in the liver are present in the spleen.
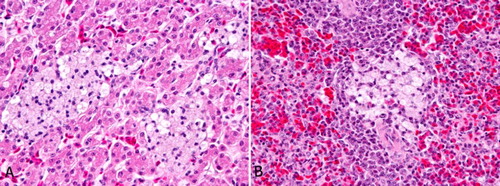
Figure 3. Polyacrylamide gel electrophoretogram of the PCR- RFLP test to screen for the known MPS IIIB two-base deletion (c.1098_1099delGG) in emus. Amplified DNA band surrounding the mutation is 294 and 292 bp in length in normal and affected emus, respectively. For the normal allele, the product is cleaved with the restriction enzyme MspI at two sites producing three bands (185, 94 and 15 bp). The mutant allele is missing one restriction site, and thus only two bands at 185 and 107 bp are seen. The 15 bp fragment is too small to be detected on the gel. Lanes: M, 100 bp DNA marker; N, normal emu; C, heterozygous carrier; A, affected emu; bp, base pair.
Figure 4. Real-time PCR discrimination plots of wild-type and mutant alleles for the two-base deletions (c.1098_1099delGG) in NAGLU. Dots at lower right (red), intermediate (green) and upper left (blue) parts indicate normal, heterozygous carrier, and affected emus, respectively. X indicates heterozygous carriers with an additional missense polymorphism.
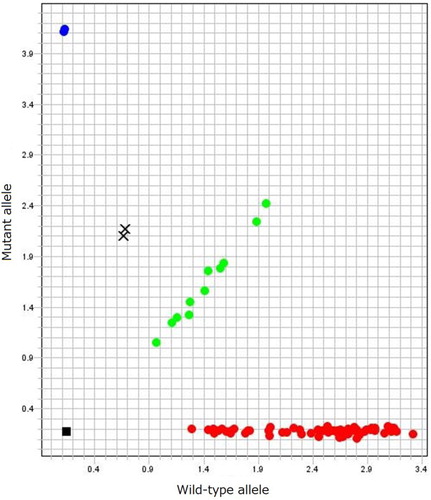
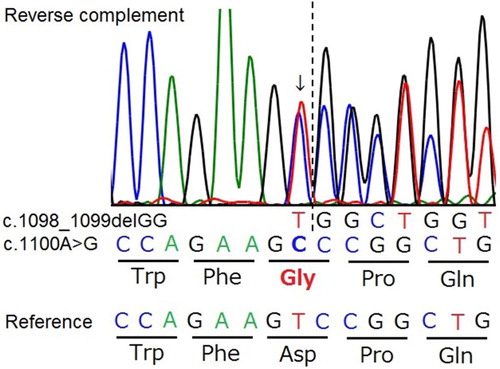
Figure 5. Genomic DNA sequencing chromatograms of a small region surrounding the known two-base deletion in NAGLU gene (c.1098_1099delGG) in a heterozygous bird also having a missense polymorphism (c.1100A > G). A single nucleotide substitution (arrow) adjacent to the known mutation site (dotted line) is predicted to change the amino acid from aspartic acid (Asp, D) to glycine (Gly, G).