Figures & data
Table 1. Basic information of bacterial strains used in this study.
Table 2. Primer and probe sequences.
Figure 1. Amplification curves for qPCR of known standards. Curves 1–5 correspond to the concentrations of 2.53 × 10⁶, 2.53 × 10⁵, 2.53 × 10⁴, 2.53 × 10³, and 2.53 × 10² copies/µl of recombinant plasmid DNA, respectively.
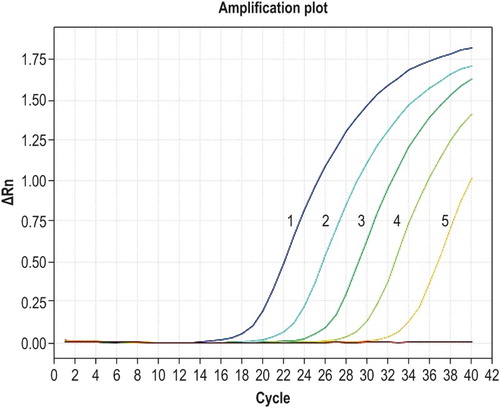
Figure 2. Specificity of qPCR. Curve 1 corresponds to G. anatis and the positive control sample; curve 2 corresponds to other bacteria and the negative control.
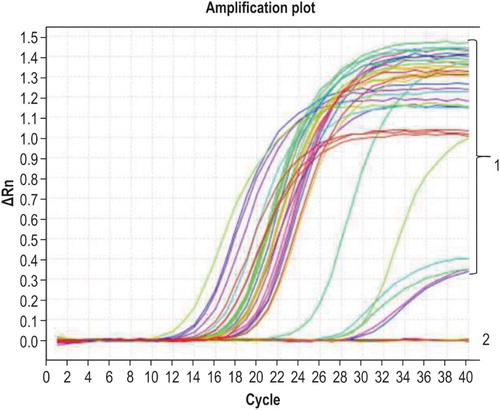
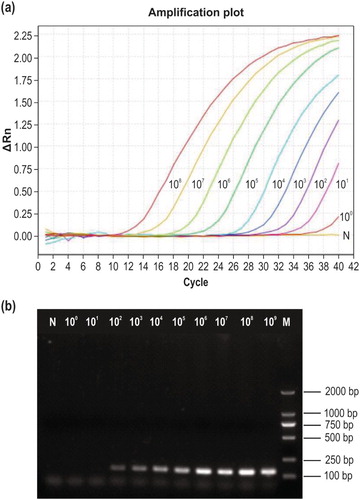
Figure 3. Sensitivity testing. (a) Sensitivity of the newly developed qPCR method. Curves 108–100 correspond to 2.53 × 10⁸–2.53 × 100 copies/µl of recombinant plasmid DNA, respectively; N, negative control. (b) Sensitivity of conventional PCR detection using the same primers. M, DL2000 DNA marker; 109–100, 2.53 × 10⁹–2.53 × 100 copies/µl of recombinant plasmid DNA; N, negative control.