Figures & data
Table 1. Colibacillosis lesion scoring.
Table 2. Clinical signs at 14 hpi after intra-airsac inoculation of a high dose of APEC O1.
Figure 1. Colibacillosis lesion scores. Inbred lines 72, 15I and C.B12 and the outbred Novogen Brown chickens were inoculated with (a) the high or (b) the low dose of APEC O1. Colibacillosis lesions were recorded at different time points. Each dot represents the total lesion score of an individual bird with a maximum score of 16. Four to six birds of each line were sampled at each time point after low dose challenge. Nine to eleven birds of each line were sampled after high dose challenge as, unexpectedly, several of the relatively susceptible birds succumbed to the infection and as a consequence all high dose birds were culled at 14 hpi (not at 2 and 7 dpi as planned). Bird numbers vary due to the availability of birds for this study. NB = Novogen Brown, inbred lines as indicated. The mean is shown. Groups with different letters are significantly different (P < 0.05).
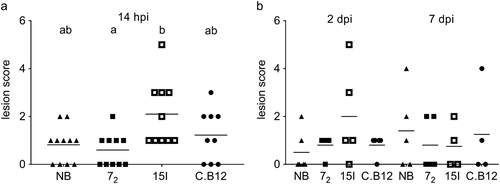
Figure 2. Bacterial colonization of tissues. Inbred lines 72, 15I and C.B12 and the outbred Novogen Brown chickens were inoculated with (a) the high or (b) the low dose of APEC O1. Bacterial loads in lung, blood and liver were determined at different time points. Four to six birds of each line were sampled at each time point after low dose challenge. One bird of the low dose group developed moderate clinical signs and was culled at 14 hpi and thus is not included in the presented data (colibacillosis lesion score 7, bacterial load in lung, blood and liver 7.08, 3.08 and 5.21 log10 CFU/g or ml respectively). Nine to eleven birds of each line were sampled after high dose challenge as, unexpectedly, several of the susceptible birds succumbed to the infection and as a consequence all high dose birds were culled at 14 hpi (not at 2 and 7 dpi as planned). Blood samples could only be obtained from surviving birds. Bird numbers vary due to the availability of birds for this study. NB = Novogen Brown, inbred lines as indicated. The mean with SEM is shown. Groups with different letters are significantly different (P < 0.05).
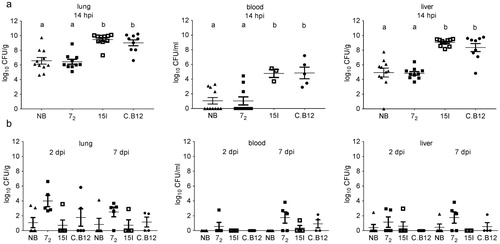
Table 3. Clinical signs at 14 hpi after intra-airsac inoculation of a high or intermediate dose of APEC O1 in resistant line 72 and susceptible line 15I.
Figure 3. Colibacillosis lesion scores. Inbred lines 72 and 15I chickens were inoculated with (a) the high, (b) the intermediate or (c) the low dose of APEC O1. Colibacillosis lesions were recorded at different time points. Each dot represents the total lesion score of an individual bird with a maximum score of 16. Six birds of each line were sampled at each time point after each challenge dose. The mean is shown. Groups with different letters are significantly different (P < 0.05).
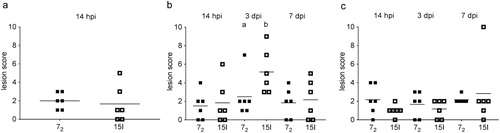
Figure 4. Bacterial colonization of tissues. Inbred lines 72 and 15I chickens were inoculated with (a) the high, (b) the intermediate or (c) the low dose of APEC O1. Bacterial loads in lung, blood and spleen were determined at different time points. Six birds of each line were sampled at each time point after each challenge dose. The mean with SEM is shown. Groups with different letters are significantly different (P < 0.05).
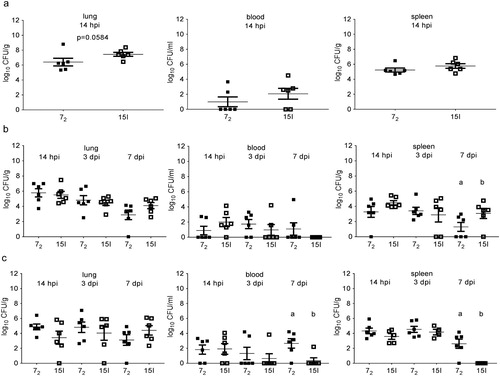
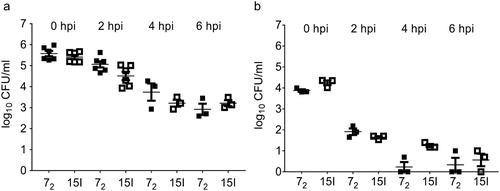
Figure 5. Phagocytic and bactericidal activity of lung leukocytes. Gradient purified lung leukocytes of inbred lines 72 and 15I were inoculated with (a) an MOI = 100 or (b) an MOI = 10 in vitro, and the phagocytic (0 hpi) and bactericidal (2, 4, 6 hpi) activity determined by enumerating viable bacteria. (a) n = 3–6 (n = 3 at 4 and 6 hpi due to limitations with bird numbers), (b) n = 3. The mean with SEM is shown.