Figures & data
Figure 1. Phylogenetic inferences deduced from nucleotide sequences corresponding to the partial hvVP2 region (left) and the partial VP1 gene (right). Main genetic lineages are indicated with shaded boxes. The names of the corresponding genogroups are indicated within brackets. Both trees were inferred using the maximum-likelihood method with the GTR + I+G nucleotide substitution model. Approximate likelihood ratio test support values are shown for relevant nodes. South American and European dIBDV strains analysed in this study are indicated with bold letters and black circles.
Table 1. Antigenic characterization of the Uruguayan dIBDV strain by AC-ELISA. Light grey = reduced binding; black grey = lack of binding.
Figure 2. Pathogenicity of the South American dIBDV strain compared to the European very virulent strain 89163. (A) Survival rate of 6-week-old SPF chickens infected intranasally with each strain or mock-inoculated, during a 10-day period post inoculation. (B) Mean symptomatic indexes of chickens recorded within 10 days post infection. (C) Bursa to body weight (BBW) ratios calculated 21 days post infection. Statistically significant differences (P < 0.05) between selected groups are indicated with different lowercase letters.
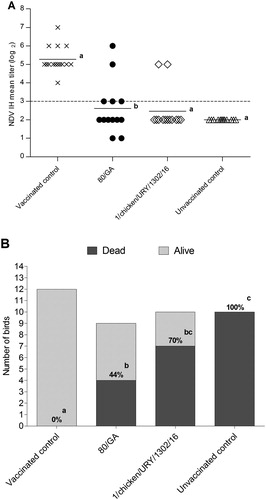
Figure 3. Immunosuppressive effect produced by the South American and European dIBDV strains. (A) HI mean titres observed 15 days after administration of the NDV vaccine in the vaccinated control group, European dIBDV strain (80/GA)-infected group and South American dIBDV strain (1/chicken/URY/1302/16)-infected group. Mean HI titres of unvaccinated control group were also measured. The dotted line indicates the positivity threshold. (B) Number of dead and alive chicks 15 days after infection with the NDV virulent strain Herts/33 for each group. Mortality percentages are shown. Statistically significant differences (P < 0.05) between selected groups are indicated with different lowercase letters.