Figures & data
Figure 1. (a) Table summarizing how each trial was organized and detailing the specific days when birds were sampled (grey shaded boxes). Two different series (S1 and S2) within the virus-inoculated groups Cc1, 2 and 3 were constructed so that the same birds were not subjected to unpleasant swabbing of the trachea everyday. (b) Flow diagram of the experimental procedure from the day of inoculation (0) to the end of the trial (28 dpi).
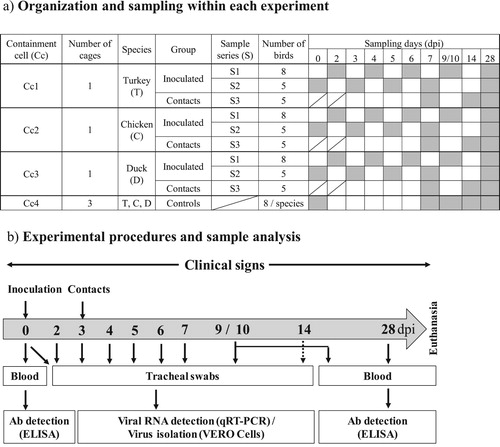
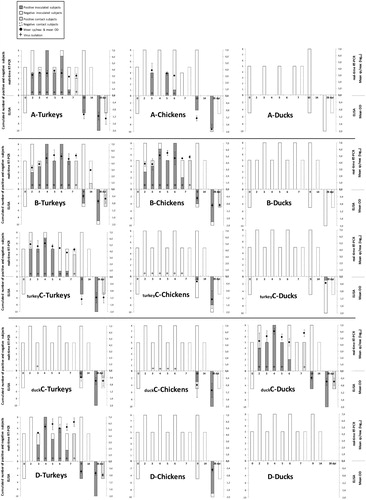
Figure 2. Results of the five bird trials undertaken in this study. Each row of three graphics shows how turkeys, chickens and ducks responded to a particular subgroup of AMPV, from top to bottom: AMPV-A, B, turkey C, duck C and D. The X-axis in each histogram shows the days post inoculation. The Y-axis to the left of each histogram should be used to read the cumulative number of positive and negative subjects by real-time qRT-PCR in the bars above the X-axis, and by ELISA in the bars below the X-axis. The Y-axis to the right of each histogram should be used to read the detail of RNA detection (dots above the X-axis), expressed as mean RNA copies/reaction, and of antibody detection (dots below the X-axis) expressed as mean ELISA optical density (OD). + Symbols identify positive virus isolation.