Figures & data
Table 1. Summary of Dg-CatD-1 delivery platforms.
Figure 1. Expression of rDg-CatD-1 and rDg-CatD-1::mCherry. (A) SDS-PAGE analysis of purified refolded rDg-CatD-1 with Coomassie staining. Arrow indicates purified rDg-CatD-1 at 42 kDa. (B) Validation of Dg-CatD-1::mCherry DNA vaccine constructs in HEK 293 cells transfected with Construct 1 (panel 1), Construct 2 (panel 2) and Construct 3 (panel 3). Negative control cells (panel 4) were transfected with empty pVAX1. In each panel localization of mCherry reporter (red) is shown. Scale bar is 50 µm. (C) Expression of Dg-CatD-1::mCherry in transgenic E. tenella oocysts. Panels 1–6 represent E. tenella Populations 1–6, respectively. In each panel localization of mCherry (red) and mCitrine (green) reporters is shown. Scale bar is 10 µm.
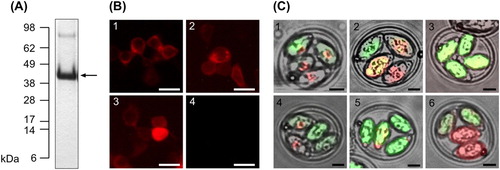
Figure 2. Haemoglobinolytic protease activity analysis of Dg-CatD-1. (A) Activity of refolded rDg-CatD-1 and soluble D. gallinae protein extract at pH 2 – pH 7 (as indicated in the figure). (B) Activity of refolded rDg-CatD-1 and soluble D. gallinae protein extract at pH 4 in the presence (+) or absence (-) of pepstatin A (2 µM final concentration). Each value is the mean ± SEM, n = 4.
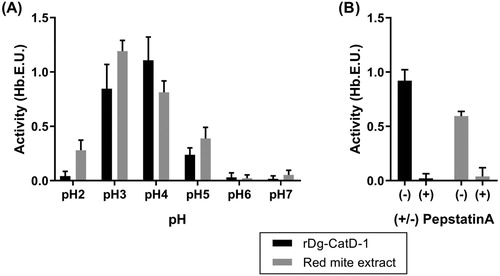
Figure 3. Immunohistochemical localization of Dg-CatD-1 in D. gallinae. Sequential D. gallinae tissue sections (5 µm thickness) were probed with either: (A) rabbit polyclonal anti-Dg-CatD-1 sera; or (B) pre-immune rabbit sera. Specifically bound antibodies were detected using EnVision+ System-HRP (DAB) (Dako) and counterstained with haematoxylin. Ov, ovary; hm, haematin granules. Scale bar is 125 µm.
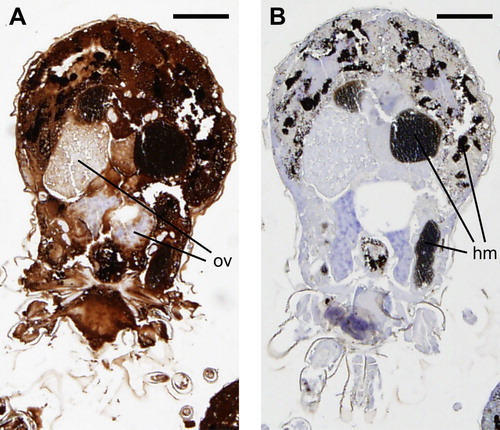
Figure 4. Comparative analysis of serum anti-Dg-CatD-1 IgY levels during the pilot vaccine trial. Comparative ELISA showing levels of circulating anti-Dg-CatD-1 IgY antibodies in chicken sera after delivery of Dg-CatD-1 antigen by: (A) recombinant protein vaccination; (B) and (C) DNA vaccination; and (D) transgenic Eimeria. Black triangles indicate time points for either rDg-CatD-1 protein vaccination, Dg-CatD-1 DNA vaccination, or transgenic Dg-CatD-1 Eimeria challenge. Sera in panels (A), (B) and (D) were used at 1/1600; serum in panel (C) was used at 1/200. Individual data points are shown for each replicate sample. At each time point n = 2, except day 51 where n = 4. Connecting line represents mean value at each time point.
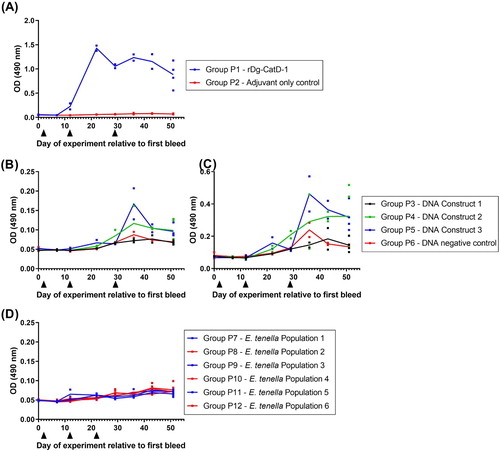
Figure 5. Comparative analysis of serum anti-Dg-CatD-1 IgY levels during the long-term vaccine trial. Comparative ELISA showing levels of circulating anti-Dg-CatD-1 IgY antibodies in chicken sera after delivery of Dg-CatD-1 antigen by: (A) recombinant protein vaccination; (B) DNA vaccination; (C) DNA vaccination prime followed by a recombinant protein boost; and (D) transgenic Eimeria. Black triangles indicate rDg-CatD-1 protein vaccination; dark grey triangles indicate Dg-CatD-1 DNA vaccination; light grey triangles indicate transgenic Dg-CatD-1 Eimeria inoculation; open triangle indicates litter change for chickens receiving transgenic Eimeria. All sera were tested at 1/1600. Individual data points are shown for each replicate sample. At each time point n = 2, except day 191 where n = 4–8. Connecting line represents mean value at each time point.
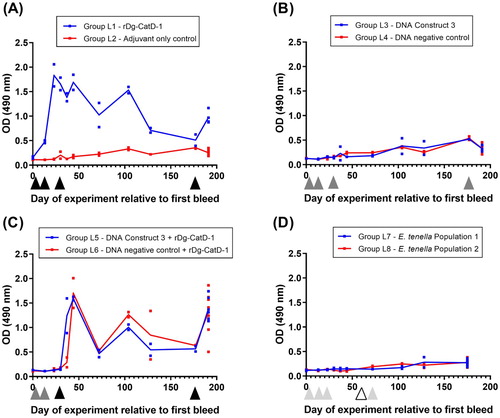
Figure 6. Comparative analysis of egg yolk anti-Dg-CatD-1 IgY antibodies from the long-term vaccine trial. Comparative ELISA showing levels of anti-Dg-CatD-1 IgY antibodies in egg yolk from birds in treatment Groups L1 – L8 (as indicated in the figure). Eggs were collected from each group at days 64 and 65 relative to the first bleed, and diluted yolks from individual eggs were used at 1/1600. Each bar represents mean ± SEM, n = 3–10. Non-significant (ns) and significant differences (****) between treatment groups are shown (t-test, P < 0.0001).
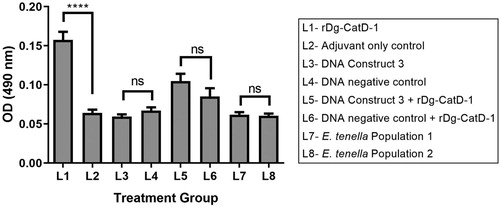
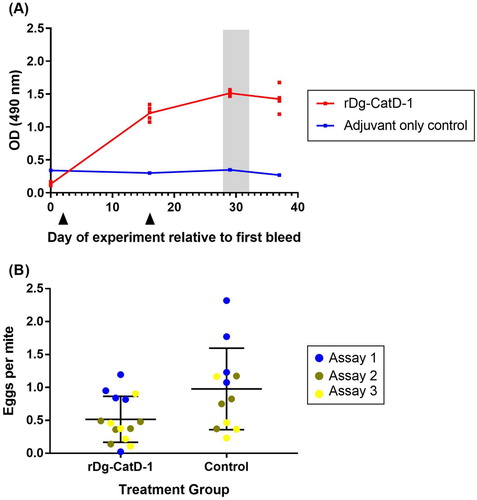
Figure 7. D. gallinae feeding trial on hens vaccinated with rDg-CatD-1. (A) Comparative ELISA showing levels of circulating anti-Dg-CatD-1 IgY antibodies in chicken sera after vaccination with rDg-CatD-1 in Montanide ISA 71 VG, or adjuvant only control. Black triangles indicate vaccination time points. All sera were tested at 1/1600. Individual data points are shown for each replicate sample (n = 5), with exception of the control group (n = 4) as a bird was removed from the trial due to health issues unrelated to the study. Following vaccination, a D. gallinae on-bird feeding trial was conducted on day 28, day 30 and day 32 (shaded grey). (B) Egg production of D. gallinae mites after feeding on birds vaccinated with either rDg-CatD-1 or adjuvant only (control). Eggs per fed mite in assay is shown at 196 h post-feeding time point. The feeding assay was repeated three times (assay 1–3) using the same vaccinated birds. Individual data points are shown for each assay with mean ± SEM (n = 15, rDg-CatD-1 group; n = 12, control treatment group).