Figures & data
Figure 1. The degree of amyloid deposition in experiment 1. (a) The degree of amyloid deposition is represented as: 4, red; 3, orange; 2, orange-yellow; 1, yellow; 0, white. (b) Mean AI scores of each group. The bars and error bars indicate the mean scores and standard deviation, respectively. *P < 0.05, **P < 0.01 vs. group A, †P < 0.05 vs. group B, by Mann–Whitney U test. Color online.
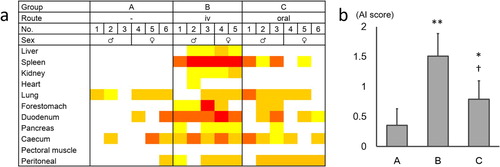
Figure 2. Macroscopic and histological features of amyloid deposition in quail. (a) Tan discoloured lesions were found in the serosa of the duodenum. (b, c) Histological image of serial sections of discoloured lesions. Severe amyloid deposition band in the serosal stroma appeared as an acidophilic nonstructural deposit by H&E (b), which stained with Congo red and showed green birefringence under polarized light (c). Bar = 100 μm. Color online.
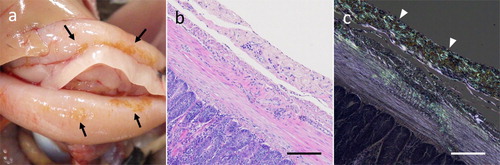
Figure 3. The degree of amyloid deposition in experiment 2. (a) The degree of amyloid deposition is represented as: 4, red; 3, orange; 2, orange-yellow; 1, yellow; 0, white. (b) Mean AI scores of each group. The bars and error bars indicate the mean scores and standard deviation, respectively. There was no significant difference between groups F and G by Mann–Whitney U test.
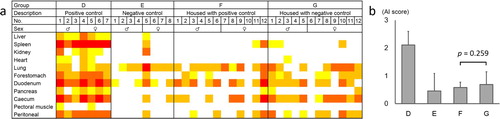
Figure 4. The degree of amyloid deposition in experiments 3 (a, c) and 4 (b, d). (a, b) The degree of amyloid deposition is represented as: 4, red; 3, orange; 2, orange-yellow; 1, yellow; 0, white; shading, not tested. IV, intravenous. *Injured individuals. (c, d) Mean AI scores of each group. The dots and error bars indicate the mean scores and standard deviation respectively. *P < 0.05, **P < 0.01 vs. negative control group, by Kruskal–Wallis ANOVA followed by Dunn's tests. ††P < 0.01 vs. oral administration group given the same dose, by Mann–Whitney U test.