Figures & data
Figure 1. The distribution of CIAV according to geographical locations. (A) Map of six ecological regions from North to South of Vietnam. (B) Chart showing the percentage of chickens in each ecological region. (C) Spatial distribution of CIAV at sampling sites: 10 northern provinces are highlighted. The stacked column indicates the proportion of CIAV-positive (red) and negative (blue) tests to the total samples collected in each province. The distribution of the CIAV genogroup in each province is indicated by ★ (genogroup G2 and G3) and ● (genogroup G3).
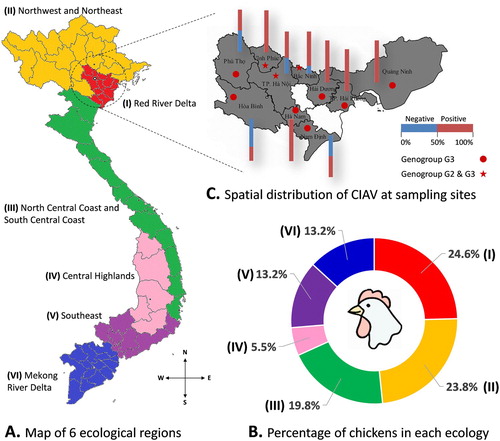
Figure 2. The detection rates of CIAV according to the type of chicken (A), housing system (B), flock size (C) and age group (D). CIAV positive rates (in percentage, black dots) and 95% confidence intervals (bars). A P-value at the top-left corner of each panel, which was 0.05 or less, indicated a statistically significant difference between group means.
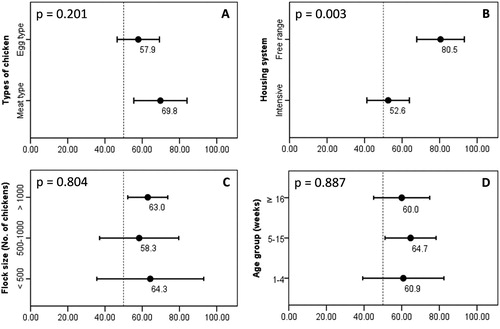
Figure 3. Phylogenetic trees of CIAV inference based on the complete genome (A), complete VP1 gene (B) and partial VP1 gene (C). The viruses were clearly divided into three genogroups from G1 to G3. The trees were outgroup-rooted by genogroup G1. Vietnamese CIAVs are coloured in violet and are indicated by arrows according to year of isolation: 2013 (empty arrow), 2016 (arrow head), 2017 (filled arrow). Asterisks (*) indicate long branches of four strains with extreme amino acid substitutions at sites 194–225 (EF552227), 249–275 (EF552229, EF552230), and 416–449 (HM134240) of VP1. The branch of vaccine and high passage CIAV strains is indicated by a vertical double-headed arrow. The scale under each tree measures changes in the unit of the number of base substitutions per site.
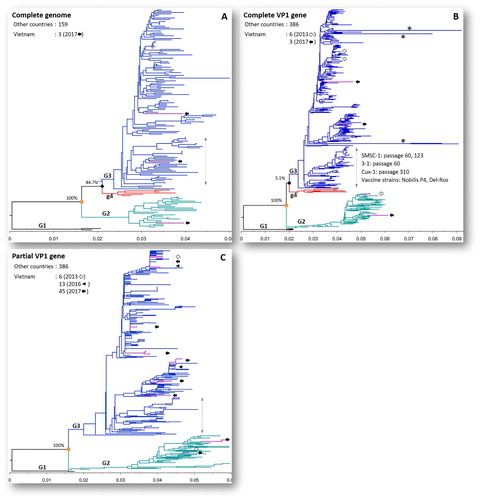
Figure 4. Whole genome comparative analysis of genetic similarity between 3 Vietnamese field strains and three genogroups of CIAV. The comparisons between genogroup 1 to genogroup 3 are shown from A to C. Each point plotted is the percentage genetic similarity within a 200-nt-wide sliding window centered on the position plotted with a step size of 20 nt and Kimura 2-parameter. Regions with genetic similarity less than 95% (dashed line) are indicated by star and asterisk symbols. The lower region in each panel shows the gene structure of CIAV corresponding to nucleotide positions in the plot map.
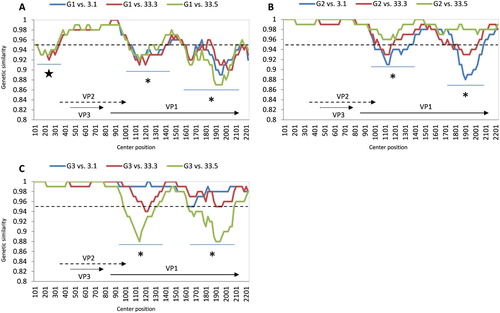
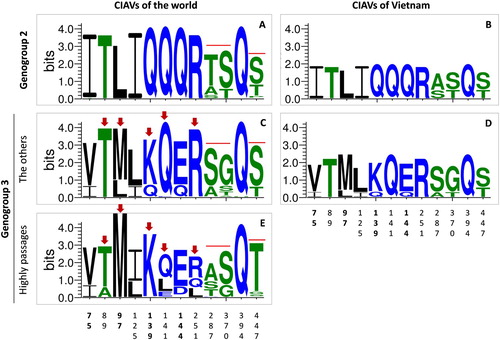
Figure 5. Sequence logo plot of important amino acid positions of the VP1 protein. The plots were created using WebLogo3 for genogroup 2 (n = 63, A) and genogroup 3 (n = 319, C, E). For comparison, amino acid sequence logos were also constructed for Vietnamese CIAVs of genogroup 2 (n = 3, B) and genogroup 3 (n = 6, D). For genogroup 3, the logo plot was separately generated for the sequences belonging (E) and not belonging (C, D) to the branch of vaccine and high passage CIAV strains (n = 74 and n = 245, respectively). Arrows indicate amino acid sites exhibiting different variations between these branches. The overall height of each stack (measured in bits) indicates the sequence conservation at that position. The height of symbols within the stack indicates the relative frequency of each amino acid at that position. Amino acids are coloured according to their hydrophobicity: blue, green and black for hydrophilic, neutral and hydrophobic, respectively. The numbers on the horizontal axis are the amino acid positions of the VP1 protein.