Figures & data
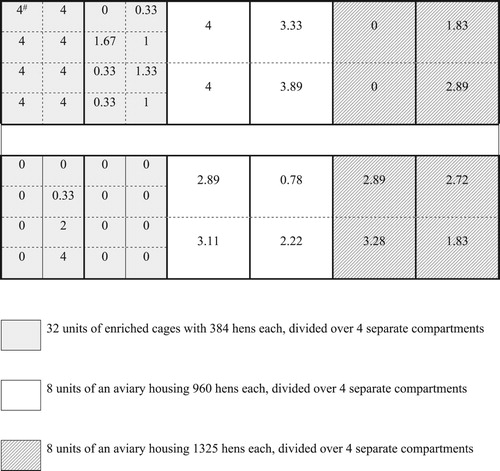
Figure 1. Infrastructure of the layer hen compartments and average MMS scores of the units at onset of fluralaner treatment (*).
*Bold lines indicate the separate compartments, dashed lines the observational units.#Mentioned figures: average MMS scores (Cox et al., Citation2009) in the 48 different units, measured immediately prior to onset of treatment.