Figures & data
Table 1. Primer and probe sequences for qRT-PCR.
Table 2. Effect of oestrogen injections, and a single LPS injection on mortality, the incidence of FLHS, and liver haemorrhagic score of laying hensa.
Table 3. Changes in blood cell counts (WBC and RBC), heterophil (H) and lymphocyte (L) percentages and H/L ratios in control and treated laying hens.a,b
Figure 1. Plasma concentrations of fibrinogen, triglycerides (TG), and gamma glutamyl transferase (GGT) in treated and untreated hens. E2 = oestrogen-treated; LPS = LPS-treated; E2 & LPS = E2- and LPS-treated; control = data are pooled for all controls (not treated, corn-oil treated and PBS-treated hens). Values are expressed as mean ± SEM (n = 6).
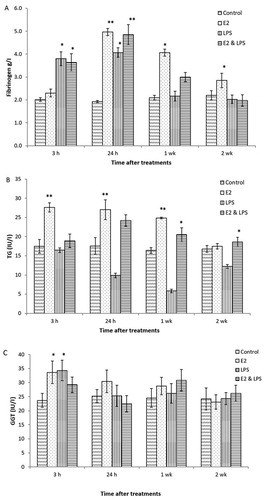
Figure 2. Histological sections (H&E stain) showing livers from control, LPS-treated, and E2- & LPS-treated hens. Image A (×200) shows normal portal triad from control hens (V = portal venule; AR = hepatic artery; BD = bile duct), with some hepatocyte fat infiltration (thin arrows). Image B (×200) shows inflammatory cell infiltration (thick arrow) in the periportal area surrounding portal triad. Images C and D (×400) show periportal inflammation in livers from E2-treated hens. Note moderate periportal inflammation (thick arrow) and fat infiltration (thin arrow). Images E and F (×400) show inflammation and haemorrhages in livers from LPS- & E2-treated hens. Note severe parenchymal and sinusoidal (S) fat (thin arrow), leukocyte (thick arrow), RBC (double-headed arrow) infiltration and sinusoidal dilation (lined area), congestion and telangiectasia.
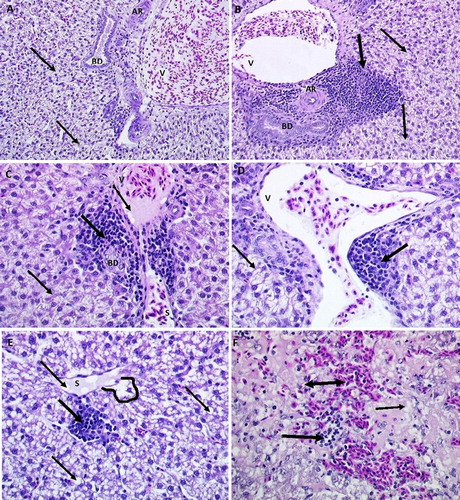
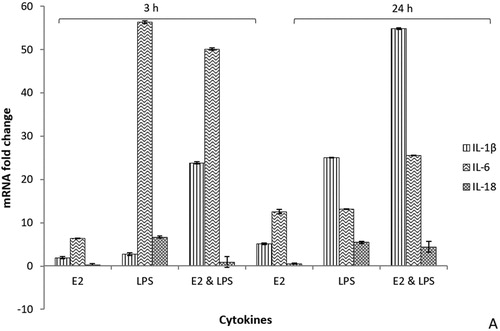
Figure 3. Cytokine mRNA expression profiles from real-time qRT-PCR analyses of hepatocytes of treated hens compared to baseline levels and controls at 3 h and 24 h post-treatments. E2 = oestrogen-treated; LPS = LPS-treated; E2 & LPS = E2- and LPS-treated. All Ct values were corrected using the housekeeping gene 28S, and time point 0 was used as the calibrator. Values are expressed as mean ± SEM fold change relative to control (data are pooled for all controls: not treated, corn-oil treated and PBS-treated birds). Error bars show SEM from triplicate samples (n = 16) from two separate qRT-PCR experiments (P < 0.01, unpaired t-test).