Figures & data
Figure 1. (a) Carcasses from the outbreaks showing high mortality. (b) Conjunctival and corneal congestion with comb and wattle congestion. (c) Greenish-yellow faecal pasting of the vent in carcasses. (d) Diffuse pancreatic necrosis. (e) Proventriculo-ventricular junction ecchymotic haemorrhages. (f) Testicular vascular congestion, severe. (g) Ovarian follicular congestion with ecchymotic haemorrhages and egg yolk peritonitis.
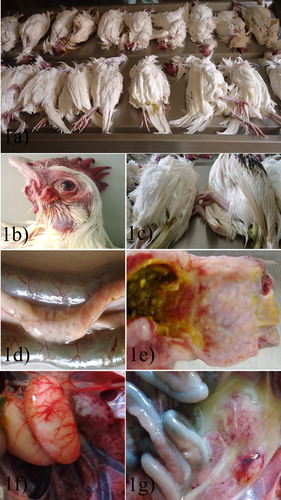
Table 1. Chronological events of the outbreak, clinical signs, and mortality.
Table 2. Distribution and intensity of gross and histological lesions with immunohistochemical (IHC) staining for NDV nucleoprotein.
Figure 2. (a) Meningoencephalitis with severe lymphocytic cellular infiltration. (b) Encephalitis with formation of perivascular lymphocytic cuffs. (c) Pancreatic acinar cells are diffusely necrotic with obliteration of islands of Langerhans. (d) Splenic lymphoid follicular necrosis. (e) Enteritis, with severe lymphocytic cellular infiltration. (f) Ganglioneuritis with lymphoplasmacytic infiltration in the intestinal wall, H &E.
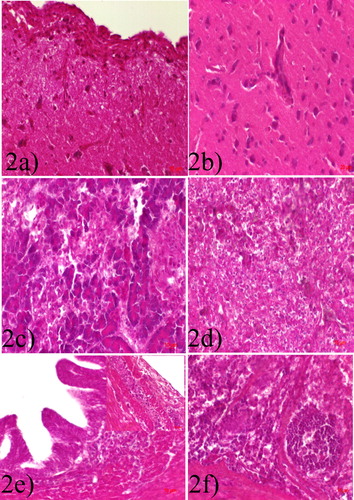
Figure 3. (a) Airsac, high intranuclear and intracytoplasmic staining in cells. (b) Meningeal epithelial lining cells intranuclear and intracytoplasmic staining. (c) Cerebral and meningeal epithelial lining cells intranuclear and intracytoplasmic staining, moderate. (d) Pancreas, severe intranuclear and intracytoplasmic staining in acinar cells X100, IHC.
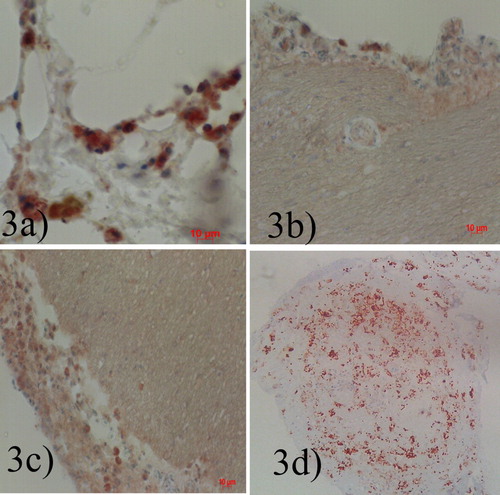
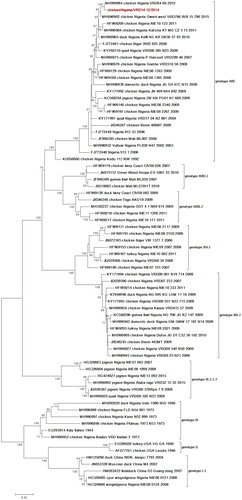
Figure 4. Phylogenetic tree of Newcastle disease virus based on the complete fusion gene. The tree was constructed using Maximum Likelihood in MEGA 6 with 500 boostrap replicates to assign confidence to the groupings. The tree with the highest log likelihood (−9569.8326) is shown. The tree is drawn to scale, with branch lengths measured in the number of substitutions per site. The isolate in this study is highlighted in red. Colour online.