Figures & data
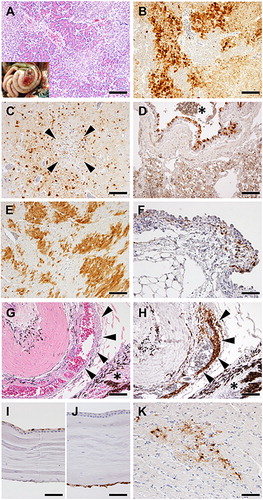
Figure 1. Time course of clinical conditions of American kestrels inoculated with the clade 2.3.2.1 H5 HPAIV. (A) (Upper) Clinical scores. Each kestrel was observed for disease manifestation at 8 h intervals. The judgement of sick and severely sick was based on the Intravenous Pathogenicity Test method (OIE, Citation2019). (A) (Lower) The onset of major clinical signs: changes in body weight (B) and rectal temperature (C) before/after virus inoculation.
Figure 2. Viral shedding and replication in tissues of American kestrels inoculated with the clade 2.3.2.1 H5 HPAIV. Average viral titres of laryngopharyngeal (A) and cloacal (B) swabs, and tissues (C) were calculated from those of virus-positive samples. The numerator and denominator of fractions above bars indicate the number of virus-positive and surviving individuals, respectively, at that time; the descriptions “3/3” and “0/3” were omitted. Asterisks denote significant differences between groups (Student’s t-test, P < 0.05).
Figure 3. Histological analysis of tissues from American kestrels inoculated with the clade 2.3.2.1 H5 HPAIV. Representative gross (inset) and histological lesions of pancreas sections (A). Histological structure around Schlemm’s canal with HE staining (G). Representative immunohistochemical staining of pancreas (B), brain (C), lung (D), heart (E), conjunctiva (F), Schlemm’s canal (H), corneal epithelium and endothelium (I and J), and optic nerve (K). Arrowheads in (C) indicate multifocal cerebral necrosis. The asterisk in (D) indicates bronchial lumen. In (G,H), arrowheads and asterisk indicate Schlemm’s canal and ciliary body, respectively. Scale bars: 100 µm (A–E, G, H); 50 µm (F, I–K).