
Figures & data
Figure 1. The workflow of Pan-RV analysis in this study to select conserved potential vaccine candidates for APEC.
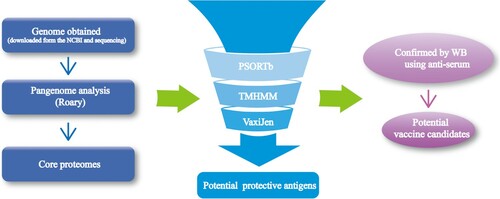
Figure 2. Summary of protein selection results in each step of the Pan-RV analysis. A total of 11,642 genes were identified after pangenome analysis in the first step; 3,001 genes were identified as core genes in the second step; after prediction of subcellular localization and transmembrane helices, 60 proteins were screened out in the third step; 53 proteins were predicted as potential protective antigens using VaxiJen server in the fourth step; four proteins were validated as the potential candidates using western blot in the last step.
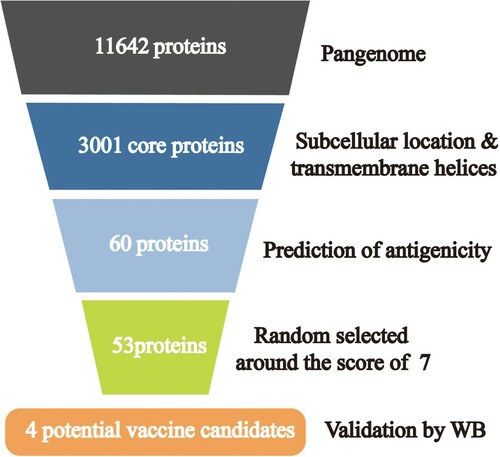
Figure 3. (a) The number of genes in the pangenome of APEC increases with the number of isolates. (b) The number of conserved genes is reduced to stabilize as the number of isolates increases. (c) Whole-genome phylogenetic tree and a matrix with the presence and absence of core and accessory genes.
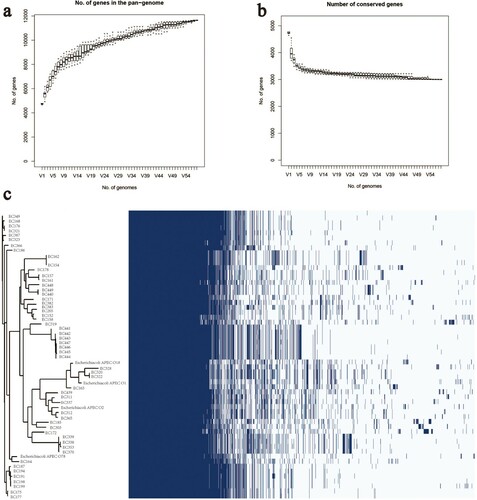
Figure 4. Location of core proteins predicted using PSORTb.
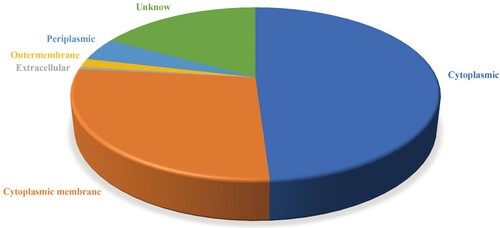
Table 1. Potential protective antigens predicted by Pan-RV analysis.
Table 2. Description of four potential vaccine candidates.
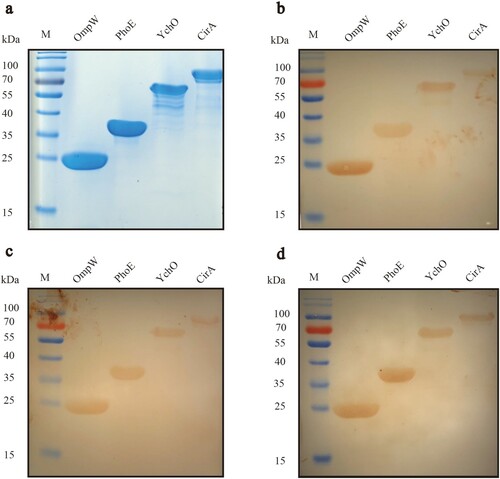
Figure 5. (a) SDS-PAGE profile for checking the expression and purification of recombinant proteins. (b) Western blotting profile verifying the immunoreactivity of recombinant proteins with anti-O1 serum, (c) anti-O2 serum, and (d) anti-O78 serum.