Figures & data
Table 1. The composition levels of basal diets.
Table 2. PCR primer sequences.
Figure 1. Effects of compound probiotics on growth performance of broilers. (A) Average daily gain, (B) Average daily feed intake, (C) Feed conversion ratio. Data are expressed as means ± SEM (n = 6). * indicates significant difference compared to the corresponding control (*P < 0.05, **P < 0.01). # indicates statistically significant difference between corresponding groups (# P < 0.05, ## P < 0.01).
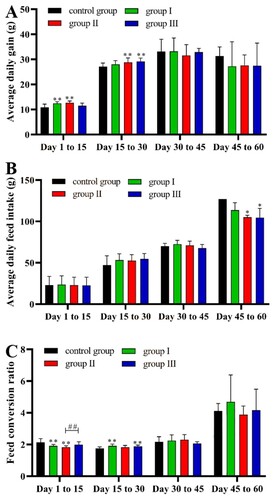
Figure 2. Histomorphometric analysis of the broiler jejunum. (A) Villus length, (B) Crypt depth, (C) Villus/crypt, (D) Haematoxylin and eosin (H&E) staining, 100 × magnification, scale bar: 100 µm. * indicates significant difference compared to the corresponding control (*P < 0.05, **P < 0.01). # indicates statistically significant difference between corresponding groups (# P < 0.05, ## P < 0.01).
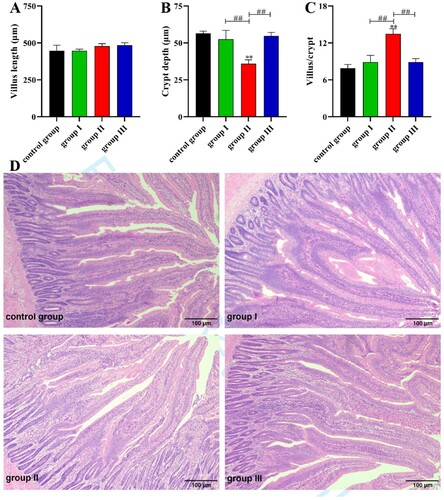
Figure 3. Serum oxidative stress level of broilers. (A) MDA content, (B) SOD activity, (C) GSH activity, (D) H2O2 content. * indicates significant difference compared to the corresponding control (*P < 0.05, **P < 0.01). # indicates statistically significant difference between corresponding groups (# P < 0.05, ## P < 0.01).
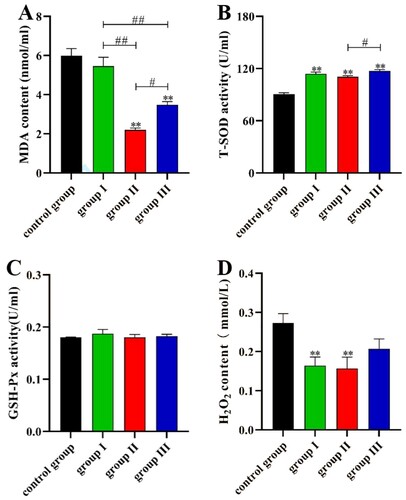
Figure 4. Effects of probiotics on TJ-related mRNA expression levels of genes in jejunum of broilers. (A) ZO-1 gene expression levels, (B) Occludin gene expression levels, (C) Claudin1 gene expression levels. * indicates significant difference compared to the corresponding control (*P < 0.05, **P < 0.01). # indicates statistically significant difference between corresponding groups (# P < 0.05, ## P < 0.01).
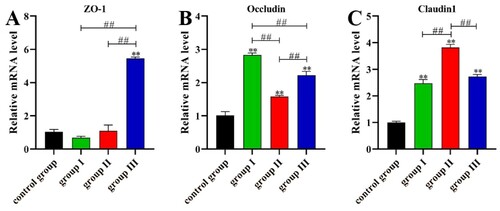
Figure 5. Welch’s t-test analysis for the significant changes of differential microbiota at phylum and genus levels in the caecum contents of broilers. (A) The Venn diagram of OTUs; (B) Microbial composition in the caecum at the phylum level; (C) Microbial composition in the caecum at the genus level; (D) Differences in the phylum level of caecum microorganisms; (E) Differences in the genus level of caecum microorganisms.
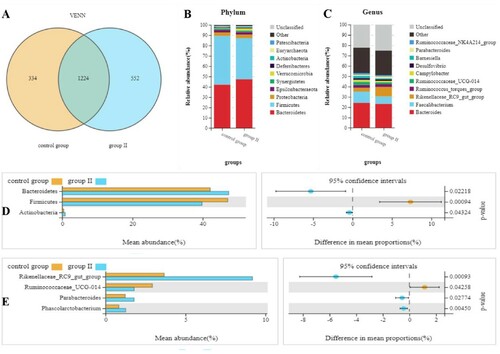
Figure 6. α-diversity and β-diversity analysis on the caecum microbiota. (A) Alpha diversity indices, including Sob index, Shannon index, Simpson index, Chao1 index, ACE index and Good’s coverage; (B) Rank-abundance distribution curve; (C) PCoA plot; (D) Analysis of similarities. The ACE and Chao1 indexes represent the community richness of the microbiota, the Shannon and Simpson indexes represent the community diversity of the microbiota. The rank-abundance curve is used to display species abundance and evenness.
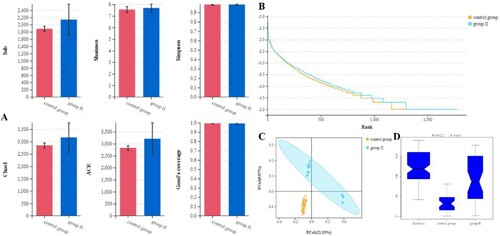
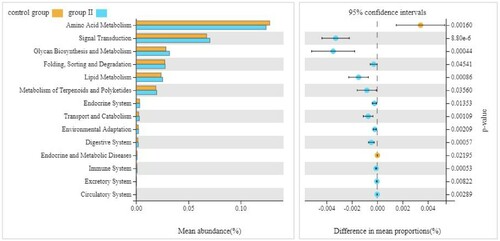
Figure 7. Predicted microbial function of caecum microbiota in broilers. Statistics were conducted by Welch’ s t-test, with P-value < 0.05 indicating a significant difference in microbial function at Level 2 of KEGG pathways.