
Figures & data
Figure 1. Positions of PCR primers (F3 and B3) and LAMP primers in the iclR family transcriptional regulator gene of Salmonella enterica subsp. enterica serovar Enteritidis.
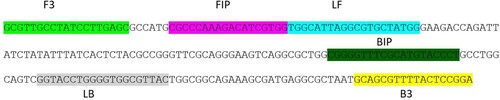
Table 1. Sequences of LAMP and PCR primers.
Figure 2. (a) Conventional and (b) normalized melt curve analysis of PCR products of the iclR family transcriptional regulator gene of salmonella from three reference strains and 23 field isolates.
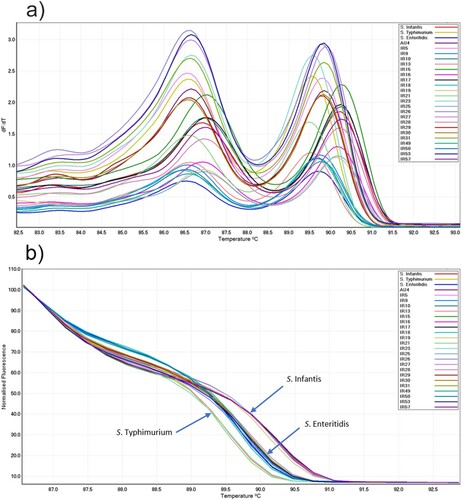
Table 2. Sample sources, PCR-HRM and LAMP assay results, including the mean ± SD of the melting points and GCP for each isolate/strain following PCR and HRM curve analysis.
Table 3. Genotyping of salmonella serovars using culture and HRM.
Figure 3. The distribution of GCP values from salmonella isolates when different reference strains, (a) S. Typhimurium, (b) S. Enteritidis and (c) S. Infantis, were used as the reference genotype. The higher GCP gap between salmonella genotypes is correlated with higher discrimination power of HRM.
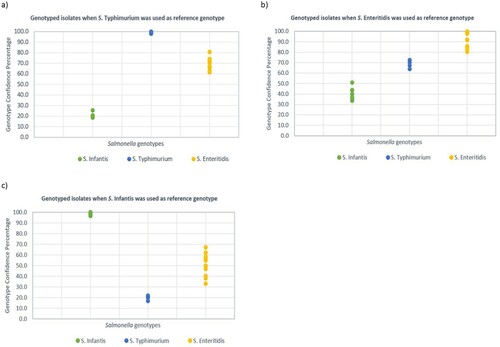
Figure 4. Alignment and comparison of nucleotide sequences of the icIR gene amplicons of salmonella isolates/strains using CLUSTAL W. Identical nucleotides are shown by ‘.’
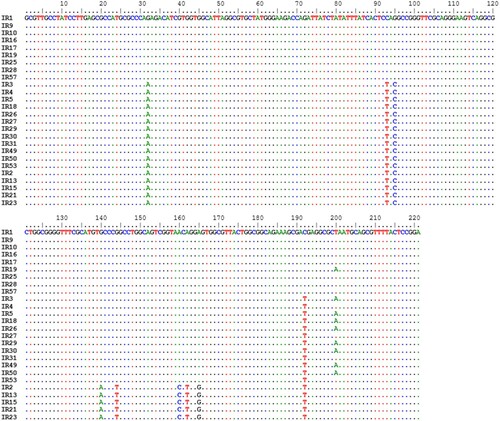
Table 4. Comparison of percentage sequence identity and diversity of salmonella isolates/strains in their iclR gene.