Figures & data
Table 1. Effect of in-water CFSM treatment on broiler performance parameters, mortality, and lesion score (Experiment 1).
Table 2. Effect of in-water CFSM treatment on broiler performance parameters, mortality, and lesion score (Experiment 2).
Table 3. Effect of in-water CFSM treatment on broiler performance parameters, mortality, and lesion score (Experiment 3).
Table 4. Effect of in-water CFSM treatment on broiler intestinal microbiome alpha diversity and relative abundances.
Figure 1. Exposure of C. perfringens CP6 to BP containing CFSM does not affect growth when measured by (a) cell turbidity at 600 nm or (b) CFU/ml. Data are the mean and standard deviation of three biological replicates.
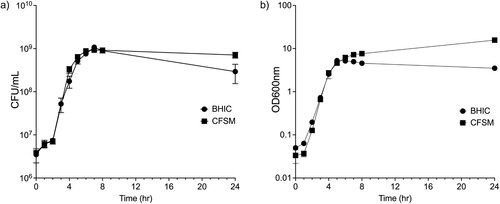
Figure 2. QS-activated virulence genes are repressed by CFSM. Time-course of CP6 toxin gene expression as measured by RT-qPCR for (a) pfoA, (b) plc (c) cloSI and (d) virT grown in BHIC alone or treated with CFSM. Expression was normalized to the reference genes ftsZ and recA, and the fold change is relative to the untreated culture at 2 h. Data are the mean and standard deviation of three biological replicates and technical duplicates. Two-way analysis of variance (ANOVA) with Sidak pairwise multiple comparison test was used to evaluate significance.
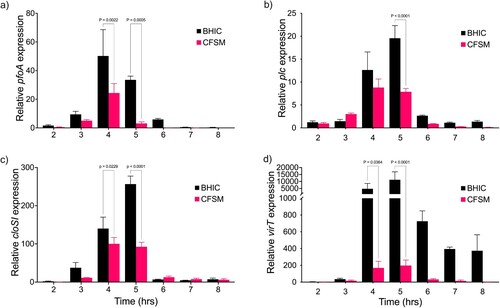
Figure 3. Expression of the netB pore-forming toxin is repressed by CFSM. RT-qPCR was performed using primers (a) netB1 and (b) netB3 on mid-log (2 h), late-log (4 h) and stationary phase (24 h) cultures of CL-15 grown in BHIC alone or treated with CFSM. Expression was normalized to the reference genes ftsZ and recA, and the fold change is relative to the untreated culture at 2 h. Data are the mean and standard deviation of three biological replicates and technical duplicates. Two-way analysis of variance (ANOVA) with Sidak pairwise multiple comparison test was used to evaluate significance.
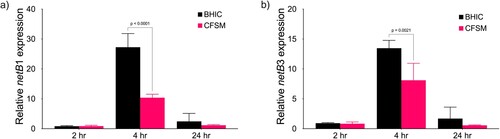
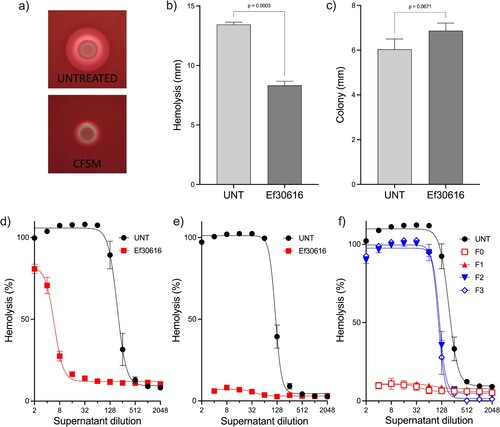
Figure 4. Haemolysis is reduced by CFSM and fractions containing bioactive peptides. (a) CP6 haemolysis on TSA-SB plates (Untreated) or with CFSM. Diameter of (b) haemolysis zone and (c) colony size for CP6 grown on TSA with sheep blood. Quantification of CP6 supernatant haemolytic activity against sheep red blood cells treated with bulk CFSM at (d) 5 h (e) 24 h, or (f) SEC fractions F0-3 at 24 h. All data are the mean and standard deviation of three biological replicates.