Figures & data
Table 1. Frequency of occurrence of biosecurity and hygiene measures from the investigated flocks.
Table 2. Detection and distribution of investigated enteric viruses in individual sample pools. Results of PCR for fowl adenovirus (FAdV), avian reovirus (ARV), chicken astrovirus (CAstV), chicken parvovirus (ChPV) and avian rotavirus (AvRV) in the investigated flocks (A-C) at the beginning of the production period (between 7–14 days of age – TP1) and at the end of the production period (between 28–35 days of age – TP2).
Figure 1. Chronological variation in the detection of enteric viruses in flocks. Detection of fowl adenovirus (FAdV), avian reovirus (ARV), chicken astrovirus (CAstV), chicken parvovirus (ChPV) and avian rotavirus (AvRV) in 49 broiler flocks investigated at the beginning (TP1) and towards the end (TP2) of production. Virus infection in a flock / at a timepoint was recognized when at least one of two investigated sample pools per TP showed a positive PCR result.
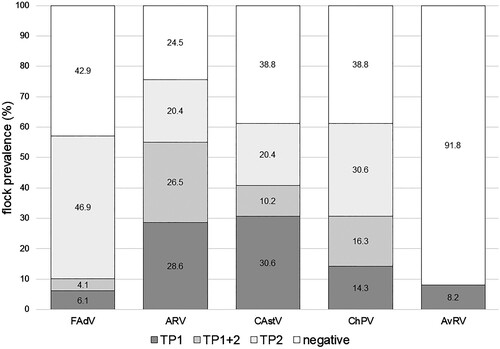
Figure 2. Prevalence of enteric virus profiles. Flock profiles of single and mixed virus infections independent of timepoint of detection.
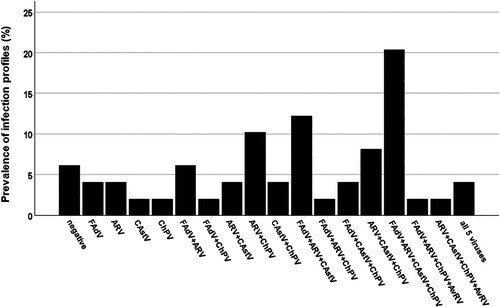
Figure 3. Effect of the number of enteric viruses detected on flock performance. Scatterplots displaying total number of enteric viruses in relation to (a) bodyweight at 28 days of life and (b) mortality in week 4. The dashed line shows the fitted model, and the shaded area represents the 95% confidence interval.
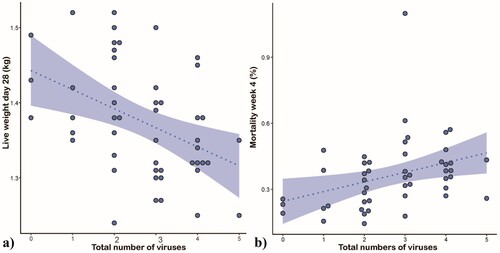
Table 3. Performance data with regards to individual virus prevalence in a flock.
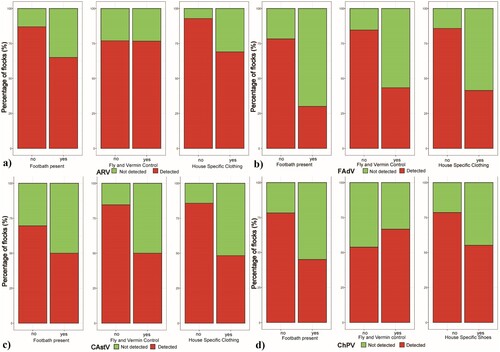
Figure 4. Influence of biosecurity and hygiene measures on virus prevalence. Bar plot presentation of flock prevalence of (a) ARV, (b) FAdV, (c) CAstV and (d) ChPV in relation to presence / absence of a foot dip bath, regular fly and vermin control and barn-specific clothing.