Figures & data
Table 1. The mass and height of the 5th and 50th percentile female and 50th and 95th percentile male (Schneider et al. Citation1983).
Figure 1. The low severity virtual rear impact average sized male dummy BioRID (left) and the average sized female EvaRID (right) (Linder et al. Citation2013).
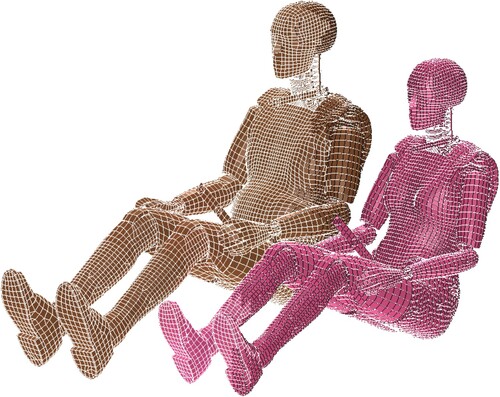
Figure 2. The low severity rear impact average sized male dummy BioRID 50M (left) and the average sized female prototype BioRID 50F (right) seated in the same vehicle seat (Schmitt et al. Citation2012).
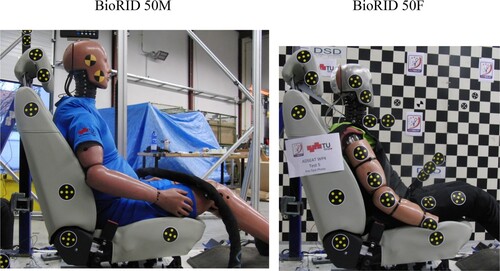
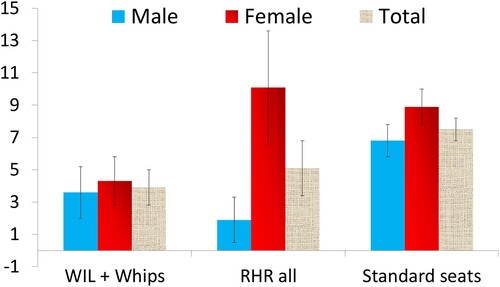
Figure 3. The proportion of drivers sustaining permanent medical impairment in three different seat categories: WIL and Whips, seats with reactive head restraint and the standard seat from Kullgren, Stigson, and Krafft (Citation2013).