1,358
Views
2
CrossRef citations to date
0
Altmetric
Articles

Environmental and transport effects of warehouse relocationing: evidence from Norway

, ORCID Icon, & ORCID Icon
Pages 37-55 | Received 02 Feb 2017, Accepted 05 Sep 2018, Published online: 17 Nov 2018

Figures & data

Figure 1. Locations of ‘newly’ established warehouses in the Oslo region.

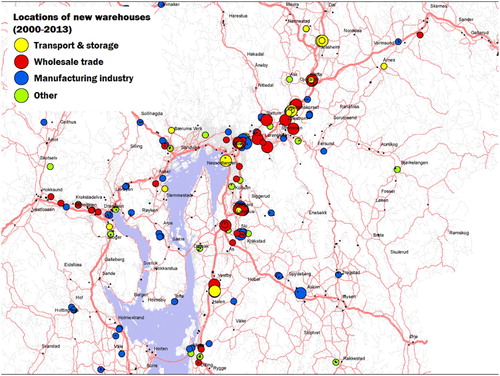
Figure 2. Locations of ‘newly’ established warehouses in the Trondheim region.

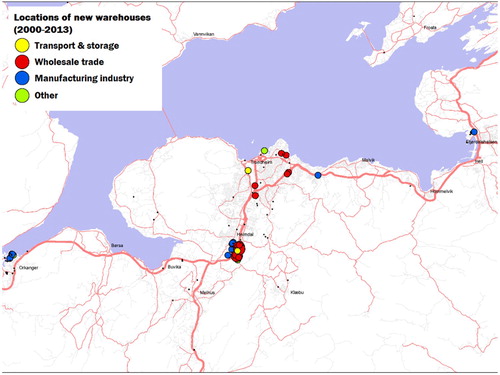
Figure 3. Relocations analyzed in the Oslo region (left) and the Trondheim region (right).

Note: Blue points indicate locations before moving, red points indicate locations after moving, dimensioned by number of firms.

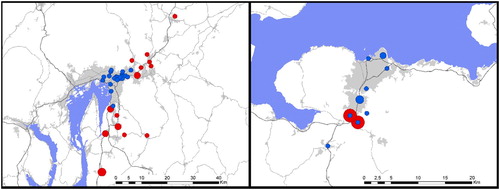
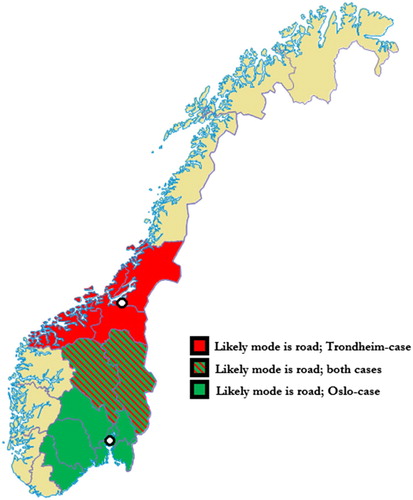
Figure 4. Norway divided by counties.

Note: For counties in green, transport to/from Oslo is predominantly by road; for counties in red, transport to/from Trondheim is predominantly by road. Striped coloring indicates an overlap: transport to/from both Oslo and Trondheim is most likely by road.

Table 1. Comparison of transport performance before and after warehouse relocation (Oslo), divided by model used and county subsets (in 1000 ton-km per year).

Table 2. Comparison of transport performance before and after warehouse relocation (Trondheim), divided by model used and county subsets (in 1,000 ton-km per year).

Table 3. Comparison of CO2-emissions before and after warehouse relocation (Oslo), divided by model used and county subsets (in ton CO2 per year).

Table 4. Comparison of CO2-emissions before and after warehouse relocation (Trondheim), divided by model used and county subsets (in ton CO2 per year).