
Figures & data
Figure 1. Pyeongtaek Port 3D layout.
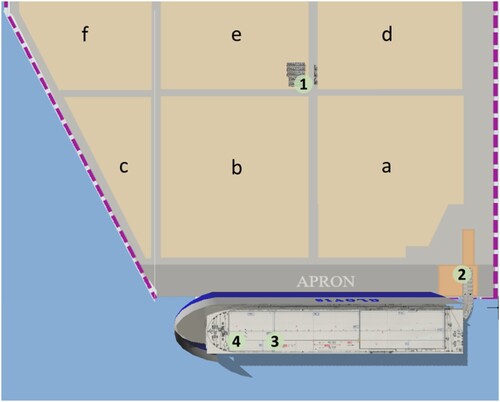
Figure 2. Simulation flowchart of current loading system.
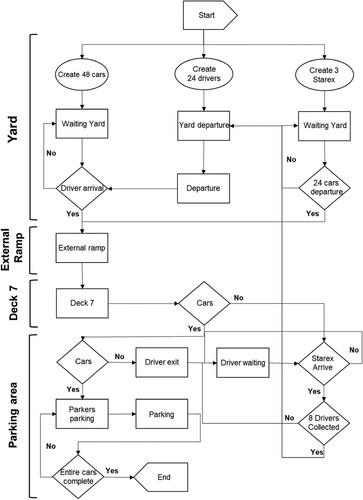
Figure 3. Simulation flowchart of CAV loading system.
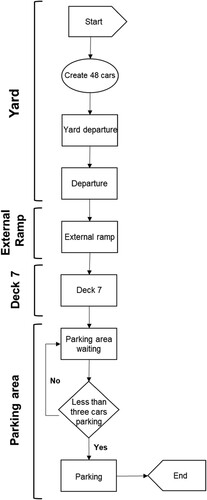
Table 1. Maximum vehicle speed (unit: m/s).
Table 2. Vehicle acceleration (unit: m/s2).
Table 3. Vehicle deceleration (unit: m/s2).
Table 4. Safe following distance (unit: m).
Table 5. CAV loading system simultaneous parking capacity (unit: s).
Figure 4. FlexSim process flow development.
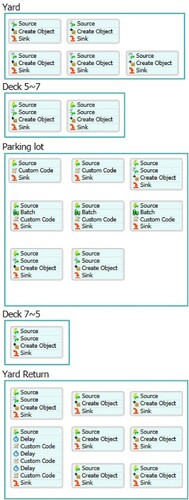
Figure 5. Simulation model of current loading system in FlexSim: (a) yard, (b) parking area.
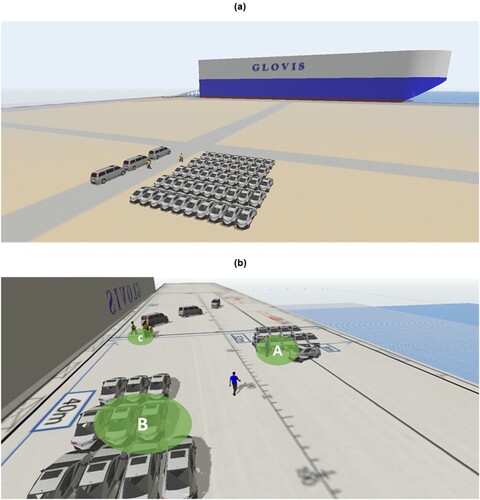
Figure 6. Simulation Gantt chart for current loading system.
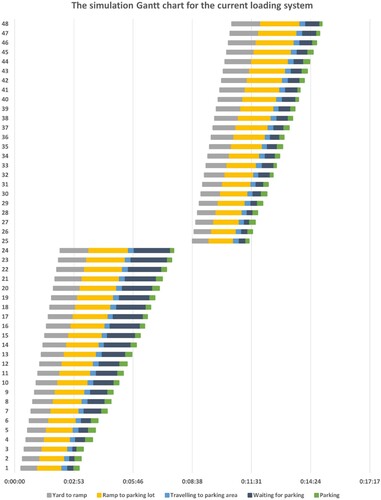
Figure 7. Stop points of shuttle vans.
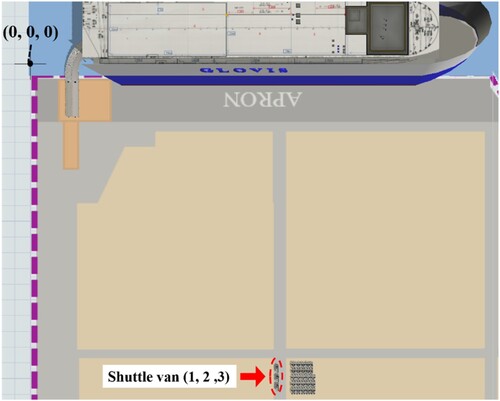
Table 6. Coordinates of start/stop points of shuttle vans (unit: x, y, z axis).
Figure 8. Simulation Gantt chart for shuttle vans.
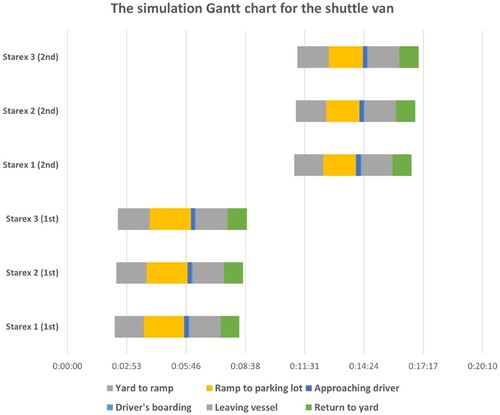
Table 7. Average waiting times at bottlenecks in current loading system (unit: s).
Table 8. Average parking times of parking attendants (unit: s).
Figure 9. Simulation Gantt chart for current loading system (8 drivers, 1 shuttle van, and 48 cars).
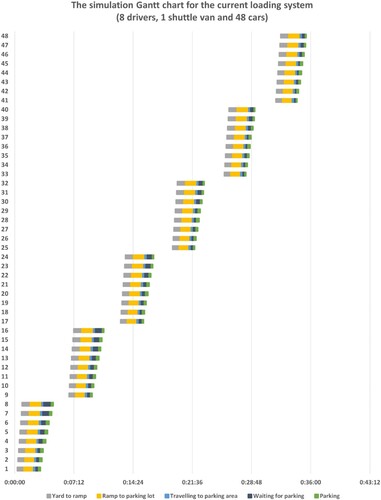
Figure 10. The simulation Gantt chart for the shuttle van (8 drivers, 1 shuttle van, and 48 cars).
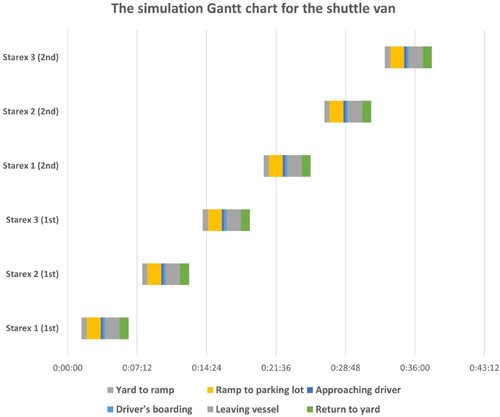
Figure 11. Simulation Gantt chart for CAV loading system.
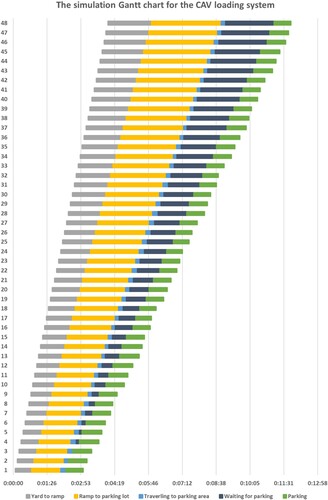
Table 9. Average waiting times within main sections in CAV loading system (unit: s).