
Figures & data
Figure 1. Elements of vulnerability. Source: Husdal (Citation2004).
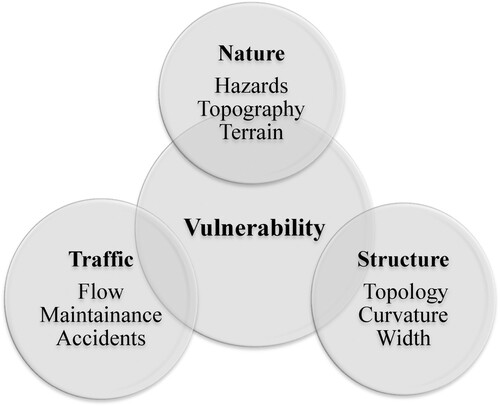
Table 1. List of some vulnerability/criticality metrics.
Table 2. The statistical tests for the gravity model.
Figure 2. Active population distribution of the metropolitan area of the city of Naples. Source: Author’s elaboration.
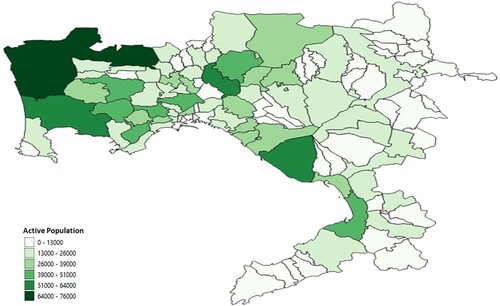
Figure 3. Jobs distribution of the metropolitan area of the city of Naples. Source: Author’s elaboration.
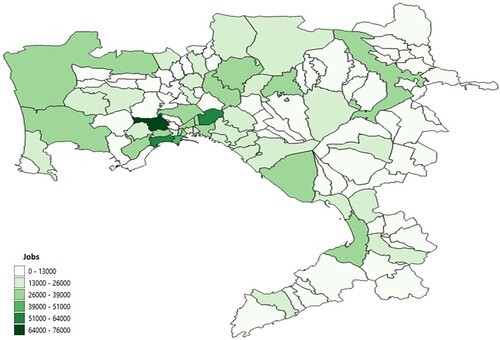
Figure 4. Main links in the study area. Source: Author’s elaborations.
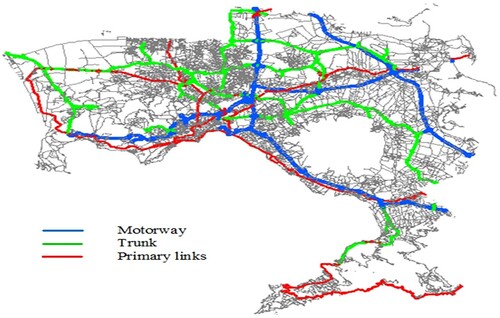
Figure 5. Districts of the metropolitan area of the city of Naples. Source: Author’s elaboration.
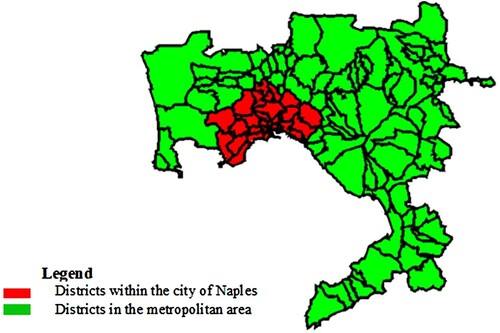
Figure 6. Distribution of the purpose of movement during the morning on a typical weekday. Source: Author’s elaboration based on Urban Plan for Sustainable Mobility.
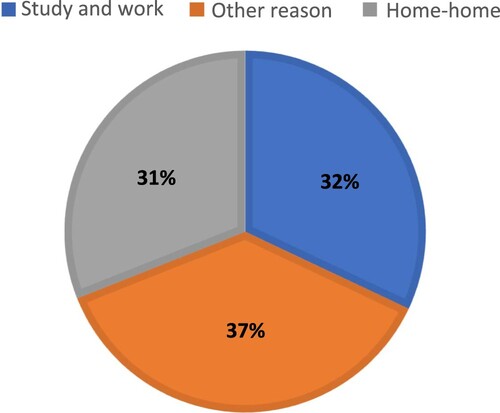
Figure 7. Modal distribution for internal movements within the metropolitan area of the city of Naples during the morning peak hours in a typical weekday. Source: Author’s elaboration based on Urban Plan for Sustainable Mobility.
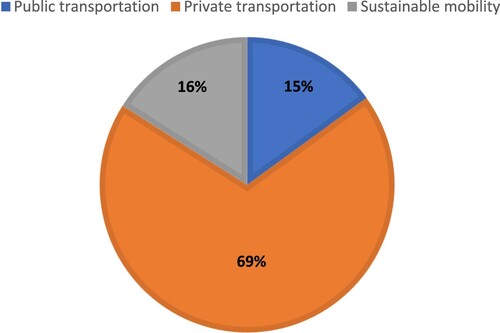
Figure 8. Links investigated. Source: Author’s elaboration.
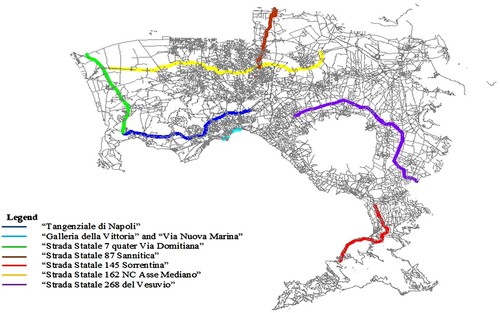
Table 3. Main characteristic of the case study.
Figure 9. Damaged districts by removing the road ‘Tangenziale di Napoli’ (scenario 1) from the network. Source: Author’s elaboration.
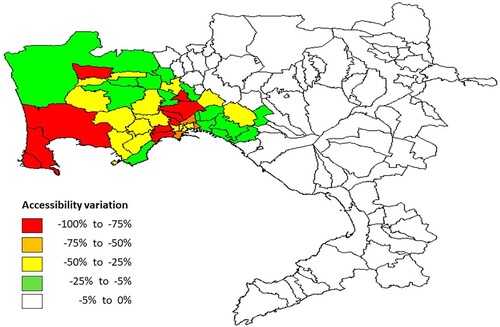
Figure 10. Damaged districts by removing the ‘Galleria della Vittoria and Via Nuova Marina’ (scenario 2) from the network. Source: Author’s elaboration.
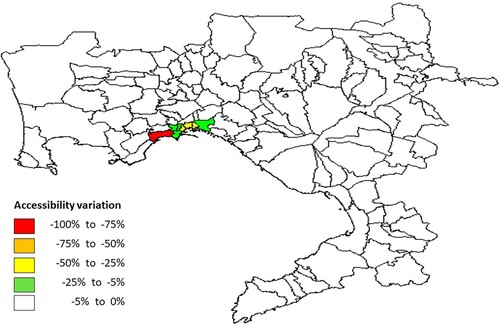
Figure 11. Damaged districts by removing the road ‘Strada Statale 7 quater Via Domitiana’ (scenario 3) from the network. Source: Author’s elaboration.
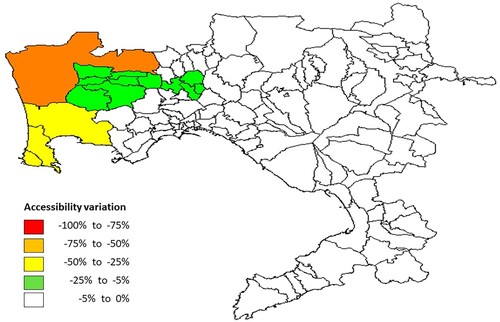
Figure 12. Damaged districts by removing the road ‘Strada Statale 87 Sannitica’ (scenario 4) from the network. Source: Author’s elaboration.
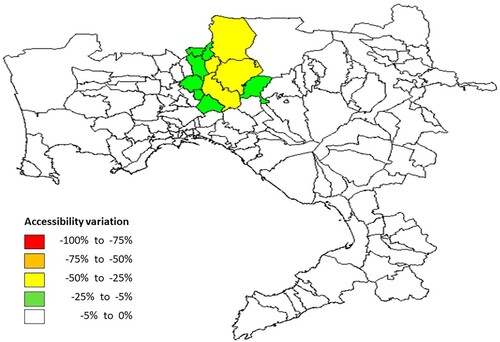
Figure 13. Damaged districts by removing the road ‘Strada Statale 145 Sorrentina’ (scenario 5) from the network. Source: Author’s elaboration.
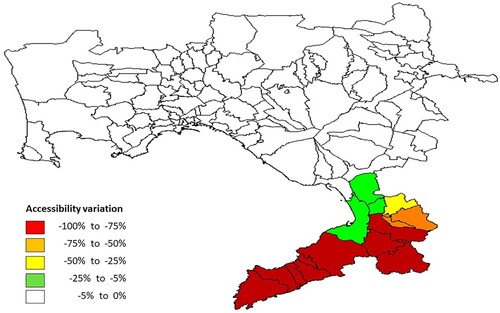
Figure 14. Damaged districts by removing the road ‘Strada Statale 162 NC Asse Mediano’ (scenario 6) from the network. Source: Author’s elaboration.
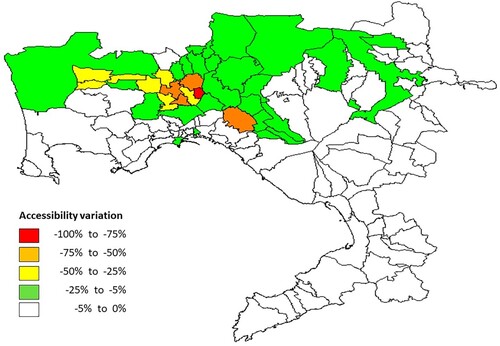
Figure 15. Damaged districts by removing the road ‘Strada Statale 268 del Vesuvio’ (scenario 7) from the network. Source: Author’s elaboration.
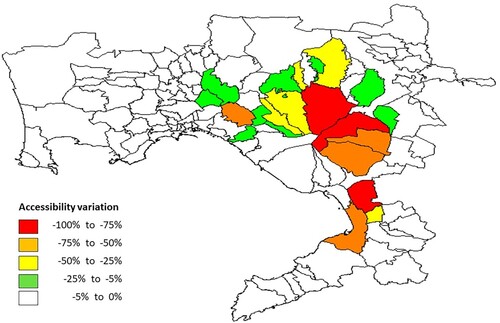
Table 4. Results.
Table 5. Link Importance Index.