
Figures & data
Table 1. Independent variables included in the binary logistic regression analysis. Variables with * have been recoded from an ordinal scale to a dichotomy variable.
Figure 1. Accepted ways of booking a DRT trip.
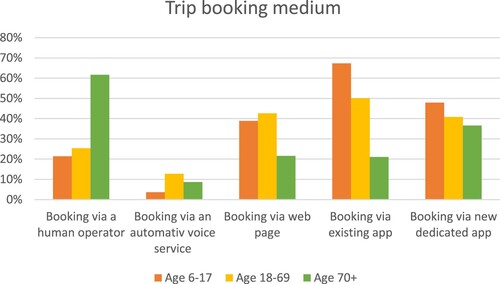
Figure 2. Accepted pick-up/drop-off stops.
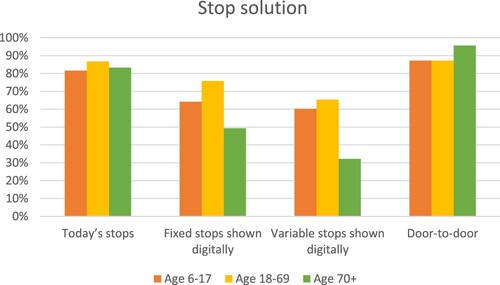
Figure 3. Accepted travel time delay, when delay information is given just before the time of departure or 1 h in advance.
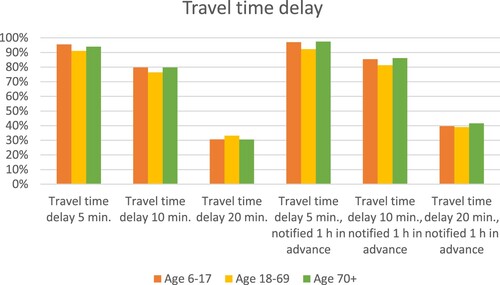
Figure 4. Accepted move of pick-up or drop-off point 100/400 m further away, when information about move is given just before the time of departure or 1 h in advance.
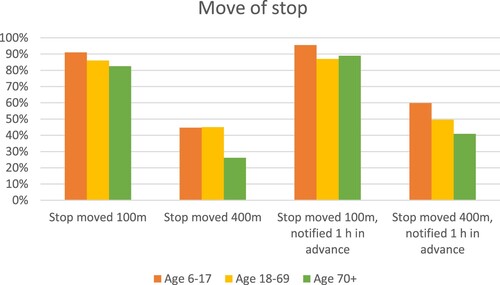
Figure 5. Required value-added services related to DRT.
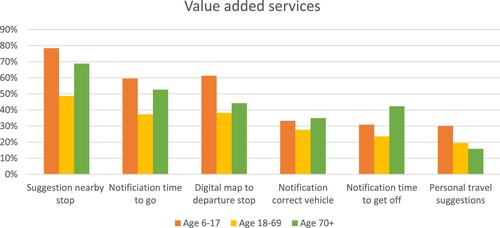
Figure 6. Acceptance of booking a trip sometime before departure. Overall significance <0.001 for differences between age 18–69 and 70+ and between age 6–17 and 70+. Differences between age 6–17 and 18–69 are not significant.
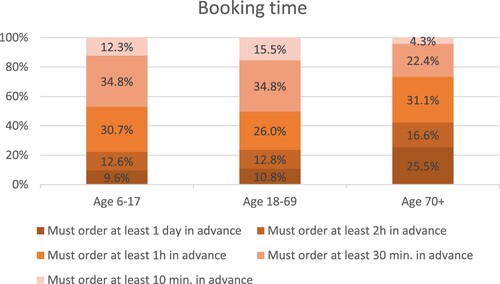
Figure 7. Acceptance of DRT travel time. Overall significance <0.001 for the differences between all age groups.
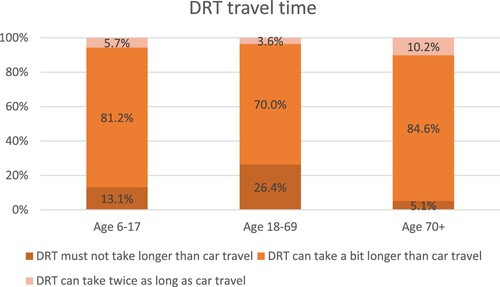
Figure 8. Acceptance of different ticketing solutions. Overall significance <0.001 for the differences between all age groups.
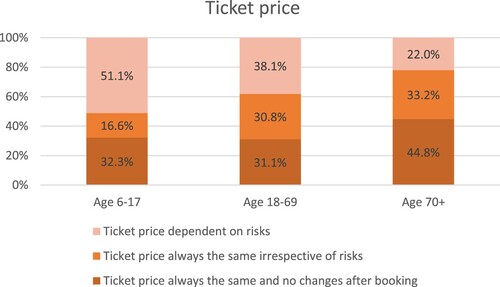
Figure 9. Anticipated usage of DRT service. Overall significance <0.001 for differences between age 18–69 and 70+. Differences between age 6–17 and 18–69, and between 6–17 and 70+ have significance <0.01.
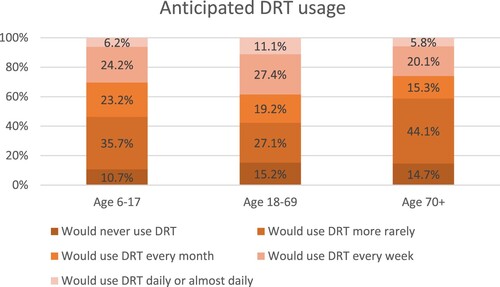
Figure 10. The percentage who state they would use DRT at least every month in subgroups of children, * indicates a difference with significance <0.05. City in this context refers to cities with more than 10,000 inhabitants.
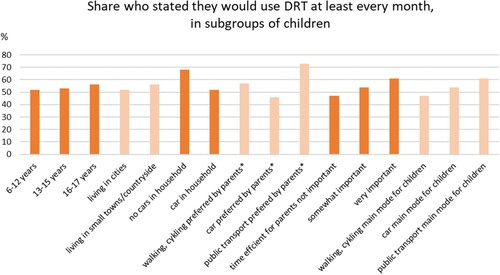
Figure 11. The percentage who stated they would use DRT at least every month in subgroups of adults, * indicates a difference with significance <0.05. City in this context is cities larger than 10,000 inhabitants.
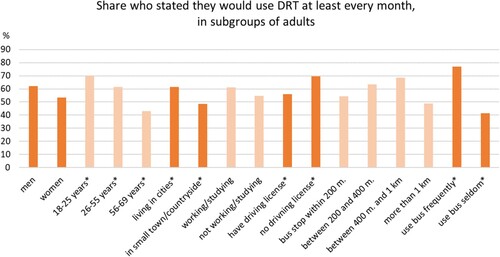
Figure 12. The share of respondents who state they would use DRT at least each month in subgroups of older adults, * indicates a difference with significance <0.05. City in this context is cities larger than 10,000 inhabitants.
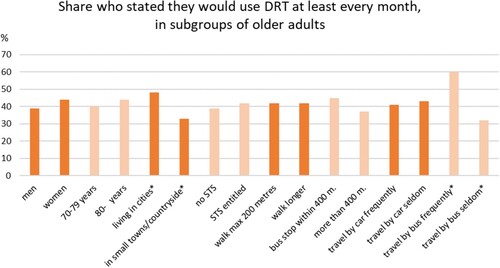
Table 2. Result from three binary logistic regression analyses, parents and children, adults, and older adults, with significance level 0.05 in bold.
Table A1. Frequency results from the DRT-related questions with yes/no answers, together with the differences between the age groups and the significance levels of these differences (pp stands for percentage points, and *, **, *** for significance levels 0.05, 0.01, and 0.001). The figures represent the share and differences of yes answers.
Table A2. Frequency results from the DRT-related question concerning booking time, together with the differences between the age groups and the significance levels of these differences (pp stands for percentage points, and *, **, *** for significance levels 0.05, 0.01, and 0.001). The figures represent the share and differences of yes answers.
Table A3. Frequency results from the DRT-related question concerning maximum travel time, together with the differences between the age groups and the significance levels of these differences (pp stands for percentage points, and *, **, *** for significance levels 0.05, 0.01, and 0.001). The figures represent the share and differences of yes answers.
Table A4. Frequency results from the DRT-related question concerning ticket price, together with the differences between the age groups and the significance levels of these differences (pp stands for percentage points, and *, **, *** for significance levels 0.05, 0.01, and 0.001). The figures represent the share and differences of yes answers.
Table A5. Frequency results from the DRT-related question concerning how often the respondent would use DRT, together with the differences between the age groups and the significance levels of these differences (pp stands for percentage points, and *, **, *** for significance levels 0.05, 0.01, and 0.001). The figures represent the share and differences of yes answers.