Figures & data
Figure 1 Birth rates (births per 1,000 women) by women’s age in selected countries, 2016.
Source: OECD (Citation2021)
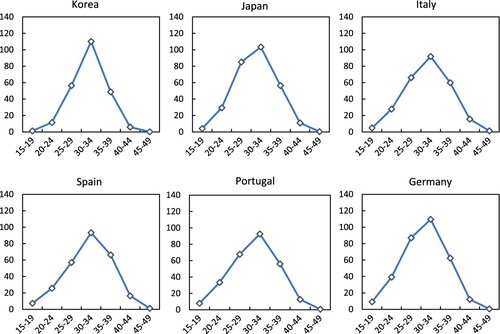
Figure 2 Proportion of workers covered by social insurance schemes, 2017.
Source: Statistics Korea (Citation2017)
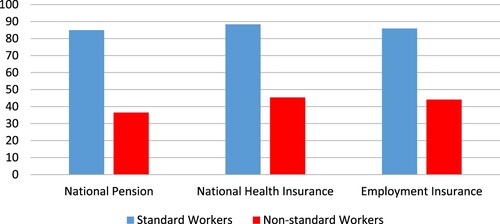
Figure 3 Survey on marriage intentions, 16–34 year olds, Seoul, 2014.
Source: Choi et al. (Citation2014)
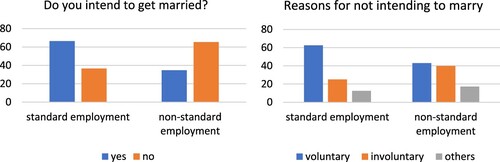
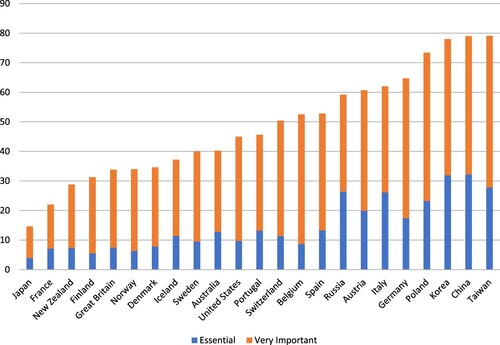
Figure 4 Responses to ISSP questions on maternal employment, 2012.
Source: ISSP Research Group (Citation2016)
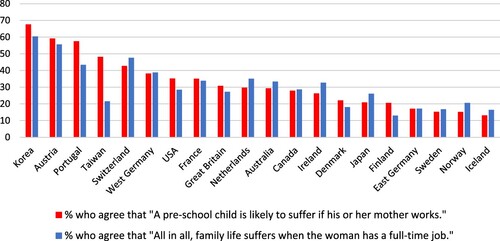
Figure 5 Gender employment gaps, by age, selected countries.
Source: OECD (Citation2021)
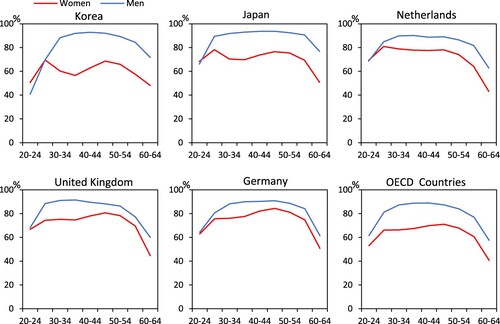
Figure 6 Proportion of employees in non-regular employment, by age and gender, 2018.
Source: Kim (Citation2018)
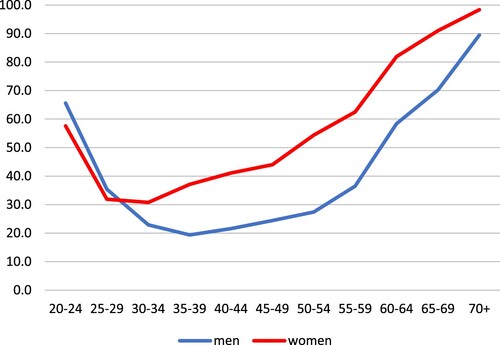
Figure 7 Economic inactivity rates among women with tertiary education, by age groups, OECD countries, 2018.
Source: OECD (Citation2019a)
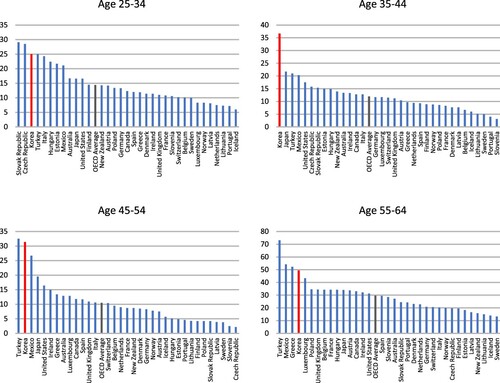
Figure 8 Participation rates and average monthly expenditure on private tuition by household income, 2021.
Source: Statistics Korea (Citation2022)
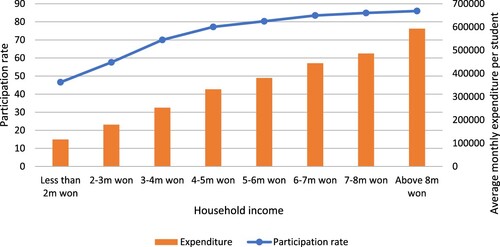
Figure 9 Importance of ‘knowing the right people’ in getting ahead in life, 2009.
Source: ISSP Research Group (Citation2017)