
Figures & data
Figure 1. Contract charter rate versus chartered period.
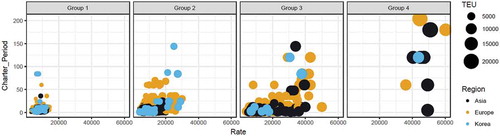
Figure 2. Distribution of charter period.
Table 1. Sample shipping lines and fleet information (as of 9 September 2016).
Table 2. Number of fixture observation by region and by the shipping company (from October 2010 to August 2016).
Table 3. Sample data number of charter contract by vessel size and regional shipping lines.
Table 4. Description and selection for input variable as indicators of shipping market condition.
Figure 3. Linear relationships between pairs of shipping market variables.
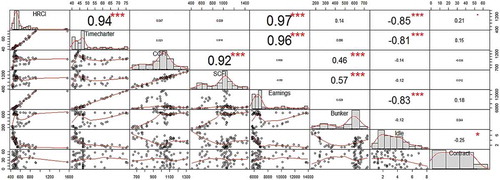
Figure 4. Contract charter rate and charter period by shipping lines.
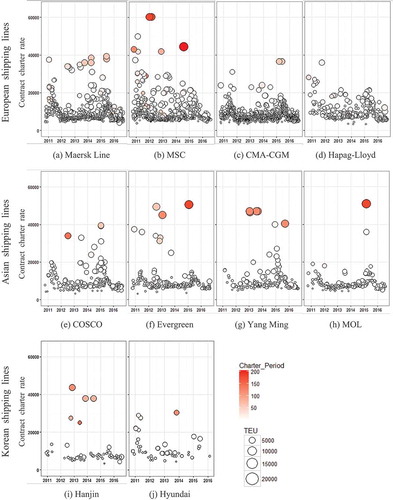
Table 5. Number of container vessel by vessel size and shipping lines.
Table 6. Descriptive statistics for vessel size, contract charter rate, chartering period, and vessel age of contracted vessels by shipping lines.
Table 7. Outlier and their input variable.
Figure 5. Influence plot for detecting outlier.
Notes: Numbers in the figure refer to the serial number of the dataset.
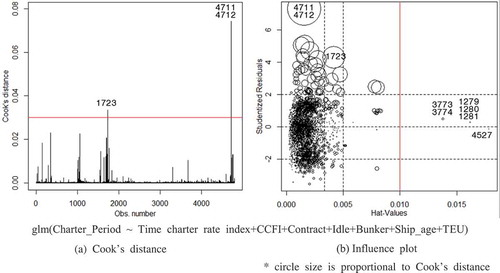
Table 8. Results comparison with each model.
Table 9. Estimation results for the parameters of charter duration.