
Figures & data
Table 1. Descriptive statistics of the emergent 3 clusters- China.
Table 2. Results of a one-way ANOVA and t-test of cluster analysis.
Figure 1. Trading partners of China based on three clusters that reflect three levels of connectivity: low, medium, and high. (Source: Authors’ own compilation).
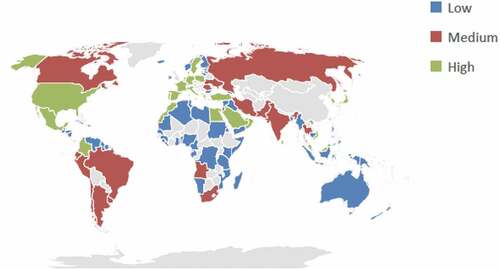
Table 3. Descriptive statistics of the emergent 3 clusters—Singapore.
Figure 2. Trading partners of Singapore based on three clusters that reflect three levels of connectivity: low, medium, and high. (Source: Authors’ own compilation).
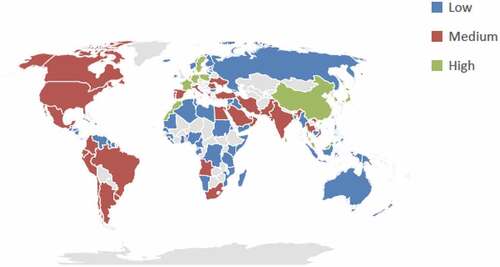
Table 4. Descriptive statistics of the emergent 2 clusters—Hong Kong.
Figure 3. Trading partners of Hong Kong based on two clusters that reflect two levels of connectivity: low, and high. (Source: Authors’ own compilation).
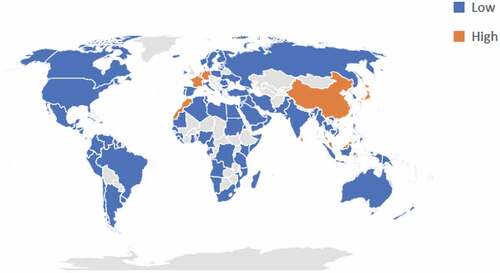
Table 5. Characterisation of clusters by the means of the LSBCI variables—China.
Table 6. Characterisation of clusters by the means of the LSBCI variables—Singapore.
Table 7. Characterisation of clusters by the means of the LSBCI variables—Hong Kong.
Table 8. Results of estimated ordered logistic regression models.