
Figures & data
Figure 1. Evaluating the effectiveness of the six policy areas for four PPIs in four scenarios.
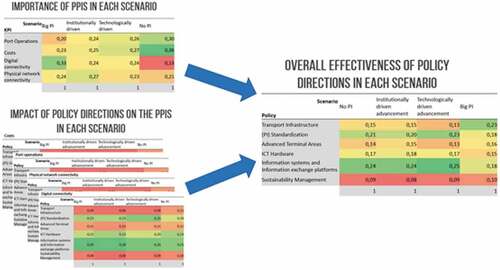
Figure 2. Research process.
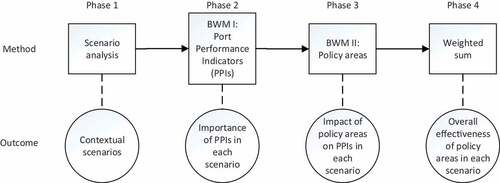
Figure 3. Scenario logic for PI ports.
Table 1. Port performance indicators with respective descriptions.
Table 2. Importance of port performance indicators in the different scenarios.
Figure 4. Weighted directed graph with respective credal rankings of the Institutional PI scenario.
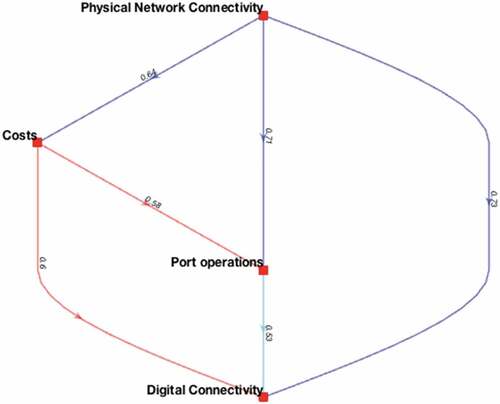
Table 3. Policy areas with respective descriptions.
Table 4. Impact of policy areas on the PPIs in the different scenarios.
Table 5. Overall effectiveness of policy areas in the different scenarios.
Table A1. Expert interviewees.
Table B1. Survey respondents BWM I.
Table B2. Survey respondents BWM II.
Table C1. Nine-point scale with linguistic variables
Table D1. Driving forces with external factors