
Figures & data
Figure 1. Determination of spot and FFA rates.
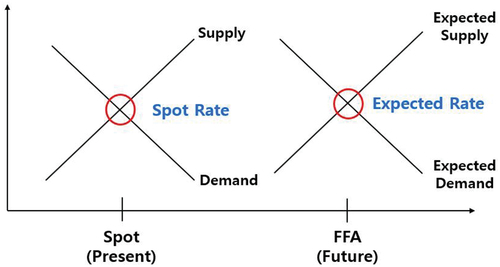
Table 1. Summary of yearly dataset.
Figure 2. Movements of demand (cargo), supply (fleet), and price (BDI) in dry bulk shipping market.
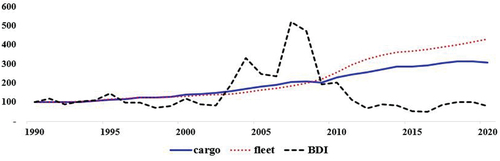
Table 2. Results of the unit root test for log-level and log-differenced data in yearly dataset.
Table 3. Results of cointegration tests and VECM estimation for yearly dataset.
Table 4. Granger–causality test results of log-level FFA, spot, and TC rates.
Table 5. Results of cointegration tests for weekly dataset.
Table 6. Summary of the weekly dataset.
Figure 3. Movements of the weekly spot, FFA, and TC rates of panamax.
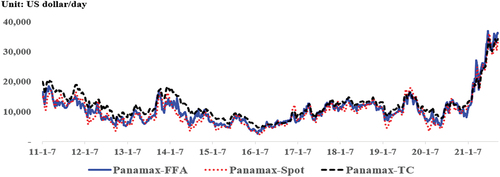
Table 7. Correlations among the spot, FFA, and TC rates of the three bulk markets.
Table 8. Results of the unit root test for log-level and log-differenced data.
Figure 4. Movements of the log-differenced data of weekly panamax spot, FFA, and TC rates.
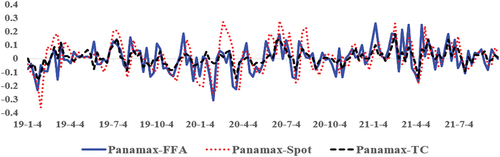
Table 9. Correlations of log-differenced data for the spot, FFA, and TC rates in the three bulk markets.
Table 10. Optimal lag length selected by AIC, SC, and HQ criteria.
Table 11. LM tests for no autocorrelation in error terms.
Table 12. White heteroskedasticity (null hypothesis: no heteroskedasticity) tests in covariance matrix.
Figure 5. Accumulated impulse response analyses of structural VAR model 1.
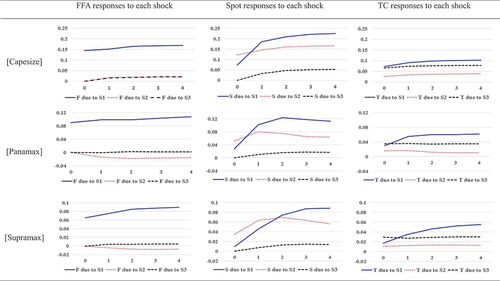
Figure 6. Forecast error variance decomposition of structural VAR model 1.
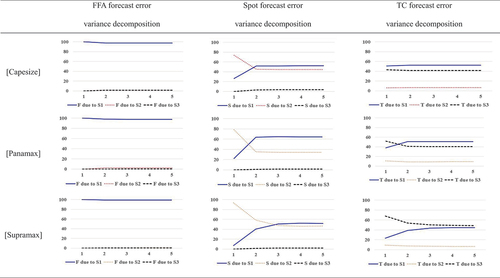
Figure 7. Accumulated impulse response analyses from structural VAR model 2.
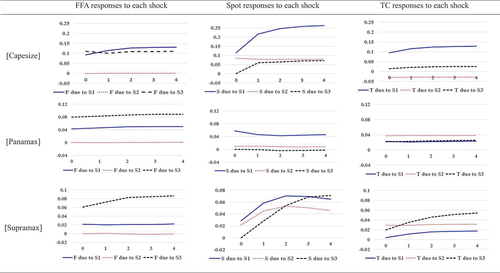
Table 13. Standard deviations for each structural shock under structural VAR model 1.
Table 14. Standard deviations for each structural shock under structural VAR model 2.
Table 15. In-sample comparisons of forecasting accuracy between VAR models.
Table 16. Out-of-sample comparisons of forecasting accuracy between VAR models.
Table 17. Comparisons of forecast directions with the VAR and VAR B-N methods.
Table 18. Comparisons of forecasting directions based on signals conditional on the forecasts generated by the VAR model.