Figures & data
Figure 1. Examples of the hand held devices used in this paper. (a) Blood Glucose metre, One Touch Ultra Mini, showing blood glucose value of 12.8 mmol/L. (b) Blood pressure monitor, Microlife WatchBP Home, showing (in descending order): The time of reading (14:06); Systolic blood pressure (122 mmHg); Diastolic blood pressure (63 mmHg) and heart rate (56 beats per minute).
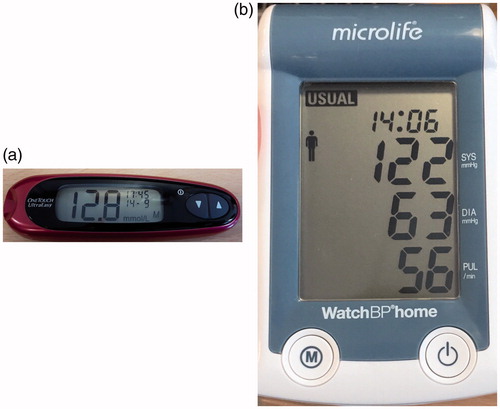
Figure 2. Examples of the images taken of the medical devices used in this paper. (a) One Touch Ultra Mini Blood glucose metre. (b) Microlife Watch Home Blood pressure monitor.
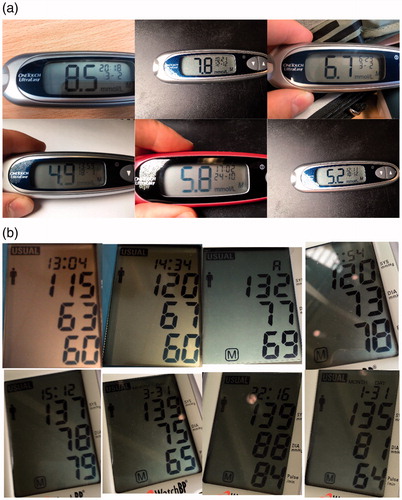
Figure 3. Examples of synthetic digits generated and saved as greyscale 52 × 52 pixel images.
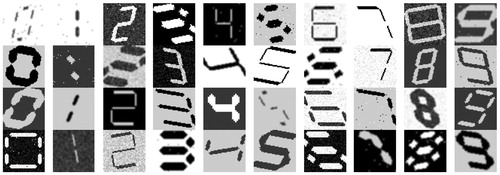
Table 1. Range of values for the parameters used to generate the synthetic dataset.
Figure 4. Example real digits extracted from the medical devices dataset and saved as a 52 × 52 pixel binary image.
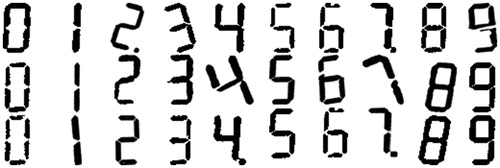
Table 2. Occurrences of each number in the “real” digit dataset.
Figure 5. Overview of methods for digit location and classification. The superscripts m and b represent the parameters for the paths taken where the blobs are extracted by MSER and CC binarisation respectively.
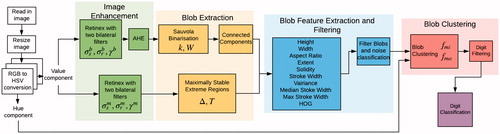
Figure 6. Example blobs from the blob extraction algorithm. (a) Blobs that do not correspond to digit segments. (b) Blobs that do correspond to digit segments.
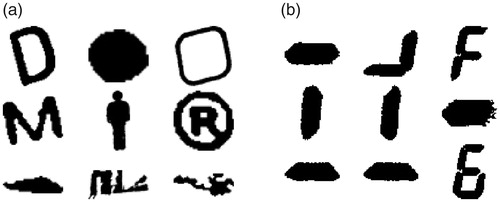
Figure 7. Blob clustering example: (a) shows the blobs extracted from an example image (each colour section represents a blob), (b) shows the ellipses fitted around each segment with alphabetic labels from a to l, (c) shows the initial graph of edges made between blobs, (d) shows the graph after edges were removed after checking conditions 1–3.
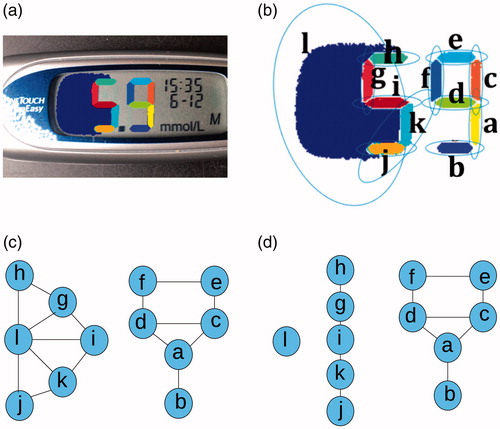
Figure 8. Single hidden layer MLP built for 7-segment digit classification using Matlab’s ‘Neural Network Pattern Recognition’ toolbox. The input vector has length 1296 plus a bias unit. The hidden layer had 56 units. The output was a vector of length 10 indicating the 10 digit classes.
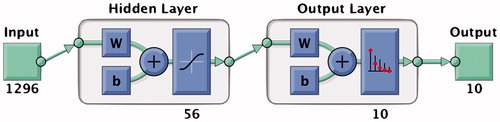
Figure 9. Locating the digits in a sample image from a blood glucose metre. Each different coloured area in the image represents a different blob. (a) Blobs detected by the blob extraction algorithm. (b) Results of the filtering and blob clustering algorithms.
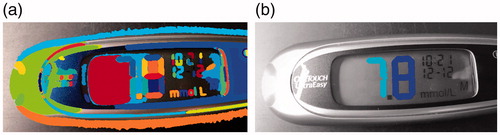
Figure 10. Changes in F1 and digit classification accuracy scores as the Jaccard index threshold is varied for images of: (a) blood glucose monitors and (b) blood pressure metres.
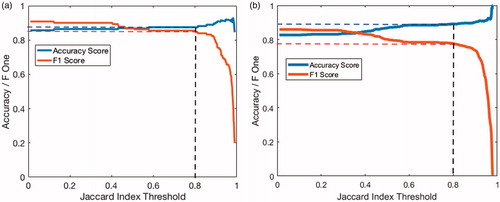
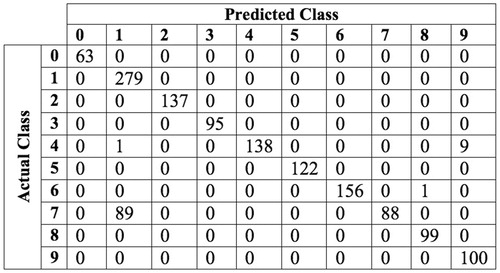
Figure 11. Confusion matrix of classifying test set 2 (real digits) using a single layer MLP on an 8 × 8 HOG feature set.