Figures & data
Figure 1. (a) The final version of the bioimpedance spectroscopy (BIS) probe head with four high-purity silver electrodes. The electrode contact areas are 4 mm × 0.6 mm. (b) The good mechanical and electrical stability of the BIS probe is assured with a 3D printed plastic frame that ensures 1 mm insulation layer between adjacent electrodes. The wires terminated to 4 mm banana sockets are directly soldered to the silver electrode plates.
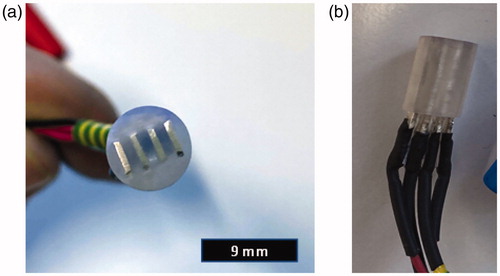
Table 1. Different steps towards successful probe construction.
Figure 2. A cross-sectional layout view of the custom-made bioimpedance probe with four rectangular high purity silver electrodes (A–D) inside the 3D printed insulation block (F).
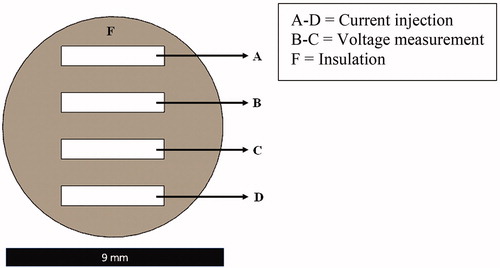
Figure 3. Schematic overview of the experimental setup for bioimpedance spectroscopic measurements with 3D printed probe (modified from Emran et al. [Citation9]).
![Figure 3. Schematic overview of the experimental setup for bioimpedance spectroscopic measurements with 3D printed probe (modified from Emran et al. [Citation9]).](/cms/asset/84a115fd-83ae-4194-9664-12d674ad41c6/ijmt_a_1831633_f0003_c.jpg)
Table 2. Mixtures of saline solutions and their nominal conductivities used as test solutions.
Figure 4. A custom-made concentric bioimpedance probe [Citation9] used for comparison. Two terminal measurements were conducted by connecting outer ring and central pin, i.e., both current injection and voltage measurement was performed using the same electrode pair. The probe head is shown in the upper right corner of the picture.
![Figure 4. A custom-made concentric bioimpedance probe [Citation9] used for comparison. Two terminal measurements were conducted by connecting outer ring and central pin, i.e., both current injection and voltage measurement was performed using the same electrode pair. The probe head is shown in the upper right corner of the picture.](/cms/asset/eb5b8aa2-e01c-41e1-b0e9-5d6adeaed62d/ijmt_a_1831633_f0004_c.jpg)
Figure 5. Biological samples (5 mm thick slices) used to evaluate the performance of the novel 3D printed probe: (a) cucumber and (b) pork tongue with indicated measurement locations.
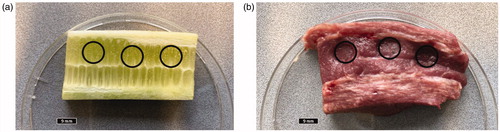
Figure 6. (a) Bode plots for all mixtures of NaCl solutions; (b) measured admittance as a function of nominal conductivity of NaCl test solutions shows excellent linearity (R2=0.999).
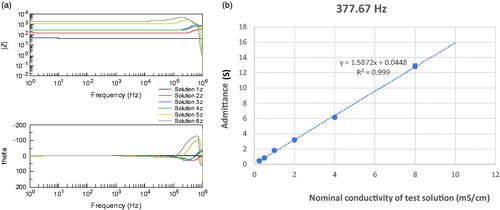
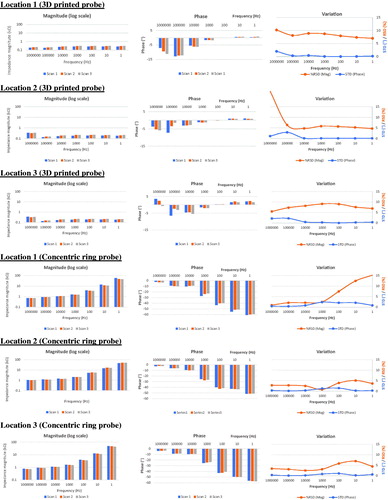
Figure 7. Impedance magnitude (left panel) and phase (middle panel) values at seven discrete frequencies (1 Hz to 1 MHz) in repeated BIS measurements (three scans) for cucumber sample. Inter-scan variation graphs (right panel) show relative standard deviation (RSD, %) of impedance magnitude and standard deviation (STD, °) of phase data. Data obtained with the 3D printed probe (upper part of figure) are shown in comparison to the concentric ring probe data (lower part of figure).
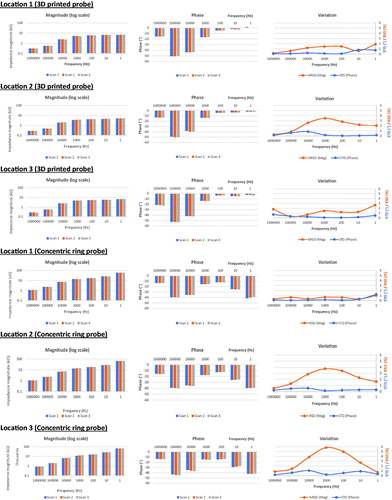
Figure 8. Impedance magnitude (left panel) and phase (middle panel) values at seven discrete frequencies (1 Hz to 1 MHz) in repeated BIS measurements (three scans) for porcine tongue sample. Inter-scan variation graphs (right panel) show relative standard deviation (RSD, %) of impedance magnitude and standard deviation (STD, °) of phase data. Data obtained with the 3D printed probe (upper part of figure) is shown in comparison to the concentric ring probe data (lower part of figure).