Figures & data
Table 1. Big data and spatial analytics module cohort size.
Figure 1. An analytical overview of population flood risk assessment using QGIS and R.
Table 2. Data sources.
Figure 2. A map showing the location of population (by OA PWC) by flood risk exposure for SW England.
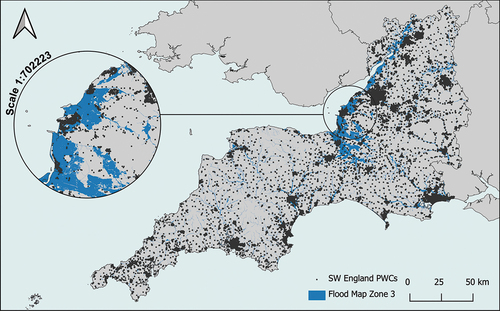
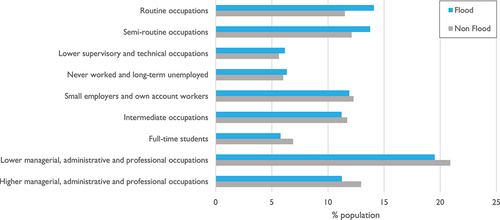
Figure 3. Bar chart showing the percentage SW England population by NS-SEC by flood risk using 2021 Census OA level data.