
Figures & data
Table 1. Descriptive statistics for the student sample.
Figure 1. Percent of level 3 qualification by POLAR4 quintile.
Figure 2. Percent of degree classification by level 3 qualification.
Figure 3. Percent of degree classification by Total UCAS tariff group. a) all Level 3 qualifications, and b) A-Level only.
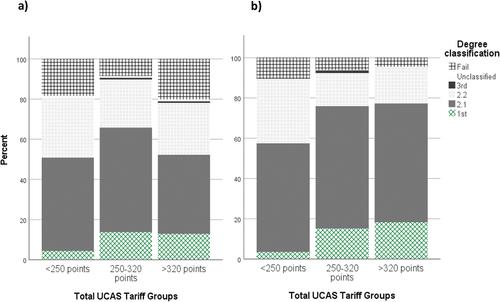
Figure 4. Percent of degree classification by Tariff from 3 group a) all Level 3 qualifications, and b) A-Level only.
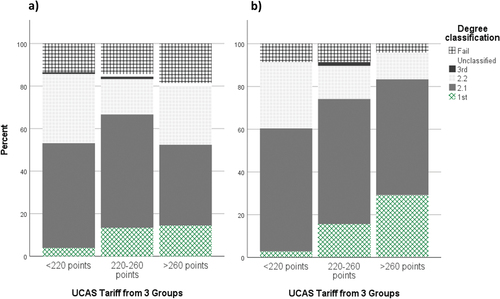
Table 2. Predictors’ unique contributions in the final multinomial logistic regression model.
Table 3. Individual parameter estimates for the final multinomial logistic regression model.