1,037
Views
11
CrossRef citations to date
0
Altmetric
Original Articles

The taphonomic attributes of a Late Cretaceous plesiosaur skeleton from New Zealand

&
Pages 333-344 | Received 15 Dec 2009, Accepted 22 Feb 2010, Published online: 30 Jun 2010

Figures & data

Fig. 1. Locality maps. A, map of New Zealand showing the position of the North Canterbury region (shaded square); B, simplified geological map of North Canterbury showing the Upper Cretaceous outcrop and the locations of the Waipara River and Haumuri Bluff.
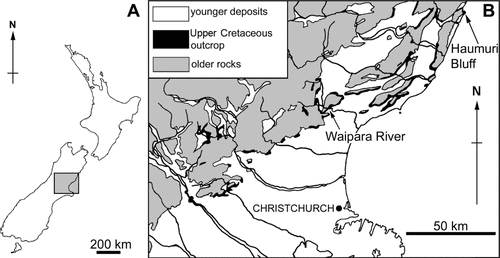
Fig. 1. Locality maps. A, map of New Zealand showing the position of the North Canterbury region (shaded square); B, simplified geological map of North Canterbury showing the Upper Cretaceous outcrop and the locations of the Waipara River and Haumuri Bluff.

Fig. 2. A, Bone map of CM Zfr 145. A, B and C are the original blocks of rock recovered from the Waipara River field site; A1–A6 and B1–B8 denote the smaller blocks into which the two largest original blocks were split. Dark grey, vertebrae and detached neural spines; pale grey, gastralia; stipple, pelvic girdle elements; dashed, pectoral girdle elements; unshaded, limb bones and ribs. N, arbitrary north used for measuring orientations of long bones. B, Diagram showing (in black) the bones represented in CM Zfr 145.
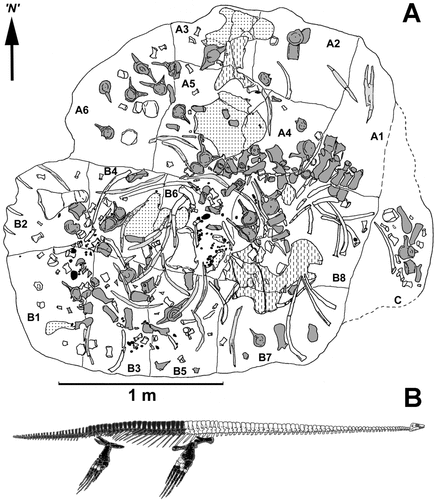
Fig. 2. A, Bone map of CM Zfr 145. A, B and C are the original blocks of rock recovered from the Waipara River field site; A1–A6 and B1–B8 denote the smaller blocks into which the two largest original blocks were split. Dark grey, vertebrae and detached neural spines; pale grey, gastralia; stipple, pelvic girdle elements; dashed, pectoral girdle elements; unshaded, limb bones and ribs. N, arbitrary north used for measuring orientations of long bones. B, Diagram showing (in black) the bones represented in CM Zfr 145.

Fig. 3. Diagrams showing the distribution of groups of bones. A, dorsal vertebrae and detached neural spines (dark grey), caudal vertebrae (pale grey) and sacral vertebrae (unshaded). B, detached neural spines and caudal ribs (dark grey) and ribs (unshaded). C, pectoral (dashed) and pelvic (stipple) girdle bones and gastralia (pale grey). D, limb bones. E, rose diagram derived from orientations of gastralia and propodials (n = 25) and lines showing orientation of ribs (n = 11). N, arbitrary north used for measuring orientations of long bones.
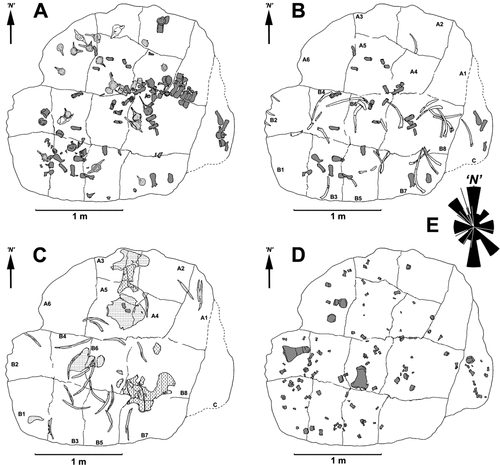
Fig. 3. Diagrams showing the distribution of groups of bones. A, dorsal vertebrae and detached neural spines (dark grey), caudal vertebrae (pale grey) and sacral vertebrae (unshaded). B, detached neural spines and caudal ribs (dark grey) and ribs (unshaded). C, pectoral (dashed) and pelvic (stipple) girdle bones and gastralia (pale grey). D, limb bones. E, rose diagram derived from orientations of gastralia and propodials (n = 25) and lines showing orientation of ribs (n = 11). N, arbitrary north used for measuring orientations of long bones.

Fig. 4. A, Dorsal view of the humerus showing the loss of bone from the distal end of the anterior edge. B, Distal corner of the femur showing fragment (arrowed) gouged from the bone. Scale bars = 10 mm.

Fig. 4. A, Dorsal view of the humerus showing the loss of bone from the distal end of the anterior edge. B, Distal corner of the femur showing fragment (arrowed) gouged from the bone. Scale bars = 10 mm.

Fig. 5. A, Ventral view of the fused coracoids showing broken fragments of the left ramus (f) and the piece of bone lost from the right ramus (bl). Ruler = 300 mm. B, Proximal end of the femur showing bone loss from the capitulum (cap) and the development of deep pits; the trochanter (tro) is well preserved. Stratigraphic up towards the top of the photograph. Scale bar = 10 mm.
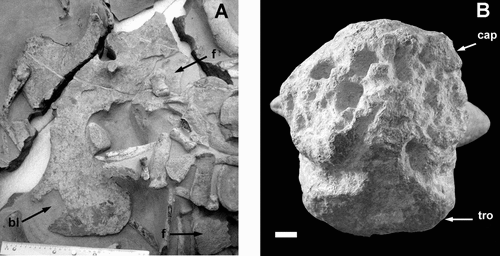
Fig. 5. A, Ventral view of the fused coracoids showing broken fragments of the left ramus (f) and the piece of bone lost from the right ramus (bl). Ruler = 300 mm. B, Proximal end of the femur showing bone loss from the capitulum (cap) and the development of deep pits; the trochanter (tro) is well preserved. Stratigraphic up towards the top of the photograph. Scale bar = 10 mm.
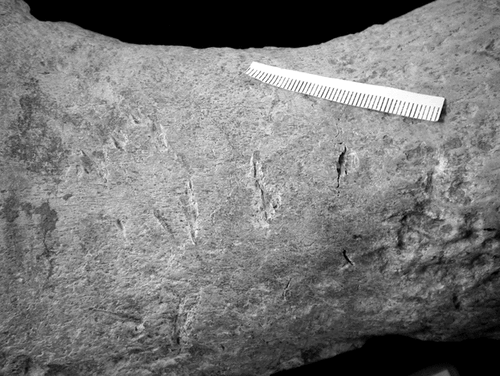
Fig. 6. Type 1 scratches on the shaft of the humerus. Scale in mm.

Fig. 6. Type 1 scratches on the shaft of the humerus. Scale in mm.

Fig. 7. Type 2 scratches. A, faint ‘scratches’ on the shaft of the femur. B, faint ‘serrations’ on the shaft of the humerus. Scale in mm.

Fig. 7. Type 2 scratches. A, faint ‘scratches’ on the shaft of the femur. B, faint ‘serrations’ on the shaft of the humerus. Scale in mm.

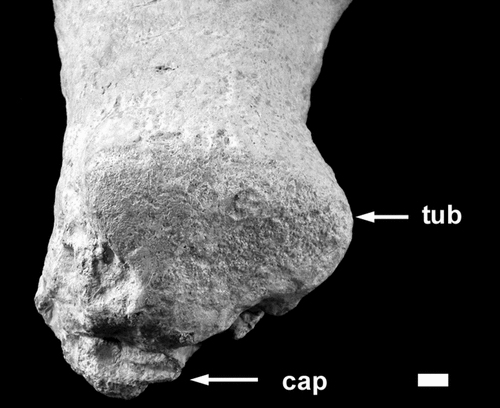
Fig. 8. Proximal end of the humerus showing the well-preserved tuberosity (tub). The capitulum (cap) has been badly degraded like that of the femur. Stratigraphic up towards the bottom of the photograph. Scale bar = 10 mm.

Fig. 8. Proximal end of the humerus showing the well-preserved tuberosity (tub). The capitulum (cap) has been badly degraded like that of the femur. Stratigraphic up towards the bottom of the photograph. Scale bar = 10 mm.
Reprints and Corporate Permissions

Please note: Selecting permissions does not provide access to the full text of the article, please see our help page How do I view content?

To request a reprint or corporate permissions for this article, please click on the relevant link below:

Academic Permissions

Please note: Selecting permissions does not provide access to the full text of the article, please see our help page How do I view content?

Obtain permissions instantly via Rightslink by clicking on the button below:

If you are unable to obtain permissions via Rightslink, please complete and submit this Permissions form. For more information, please visit our Permissions help page.