Figures & data
Figure 1. Family-level phylogeny of diprotodontian marsupials. A, The favoured molecular tree in phylogenetic analyses of MtNuc20654. The consensus of recent molecular studies collapses the branch indicated by the asterisk. Maximum likelihood bootstrap support is shown at nodes when less than 100%. All nodes received 100% Bayesian posterior probability. B, Algorithmic morphology tree favoured under MP and ML analyses of morph352. C, Tree inferred under the optimal mixture (see ) of molecular phylogenetic (sim352) and ecological (size/diet) signals. Ancestral diet was reconstructed under ordered MP (herbivorous; dark green/dark tone, plant-dominated omnivorous; light green/light tone, broadly omnivorous; orange/intermediate tone, nectivorous; dashed). Circles indicate average adult mass (open; 0–50 g, 1 closed; 50–200 g, 2 closed; 200–800 g, 3 closed; 800 g–3 kg, 4 closed; 3–12 kg, 5 closed; >12 kg). Half circles indicate variation between species (e.g., 3, 4 for Phalangeridae). Diet and size states are assigned according to the attributes of the species included in the studies from which the morph352 dataset is derived.
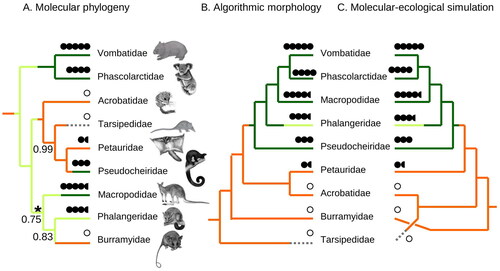
Table 1. Likelihood disadvantage of diprotodontian phylogenies from alternative data sources.
Figure 2. Maximum parsimony treelength disadvantage. Percentage additional treelength required for the diprotodontian molecular consensus (open circles) and for the algorithmic morphology tree (closed circles), relative to the treelength of the MP topology, for each mixture of phylogenetic (sim352) and ecological (size/diet) characters. Optimal fit to the algorithmic morphology tree occurs with the ecological characters multiplied out to contribute 2.9% of the data. Fit to the molecular consensus tree continues to deteriorate (25.1% treelength disadvantage at 16% ecological contribution).
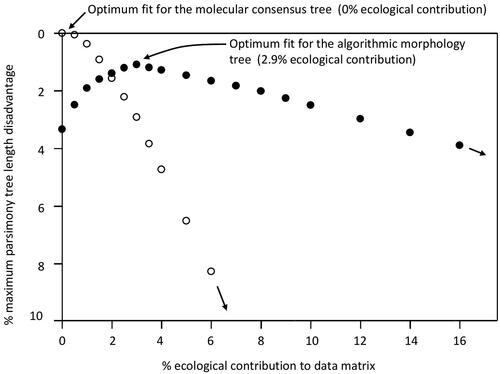
Table 2. Reverse engineered phylogeny (REP) scores for alternative diprotodontian phylogeny hypotheses, (a) the favoured tree on the morphological character matrix, morph352 (), (b) the favoured tree on the molecular matrix, MtNuc20654 (Fig. 1A), and the two other topologies that are consistent with the molecular consensus, which includes a basal trichotomy among phalangeroids, (c) grouping phalangeroids + petauroids (possum monophyly) and (d) grouping macropods and petauroids. The REP score is the morph352 MP score minus the size and diet signal correction (size & diet MP score) × 10.2, where 10.2 is the optimal character contribution to apparent phylogenetic signal (2.9% of the 352 characters; see ).
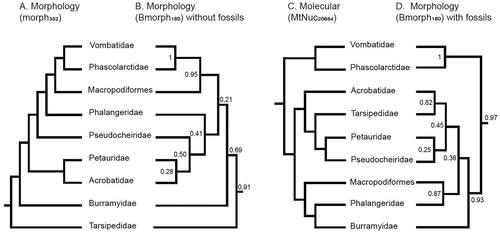
Figure 3. Comparison of A, the morph352 tree and C, the MtNuc20654 molecular tree, respectively, with the diprotodontian phylogenies reconstructed from Bayesian inference of the Bmorph180 dataset B, without including fossil taxa and D, with fossil taxa included. Node support values on the Bmorph180 trees are Bayesian posterior probabilities.