Figures & data
Figure 1. Locality map, highlighting the study site and other sites mentioned in text (modified from Breed & Ford, Citation2007 and the Atlas of Living Australia (https://www.ala.org.au/). the type locality for Notomys longicaudatus is the Moore River in southwestern Western Australia.
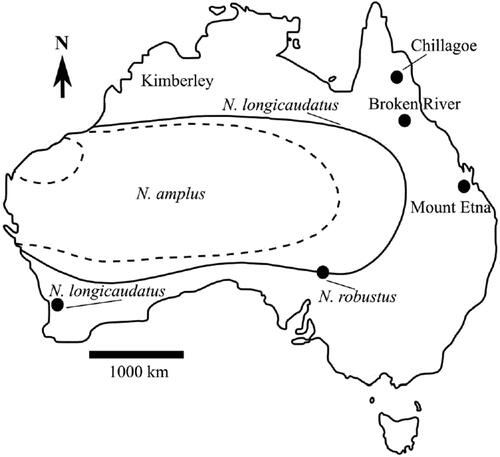
Figure 2. Diagrammatic representation of M1-3 of Notomys magnus sp. nov., showing Notomys molar terminology used throughout the text. Cusp terminology follows Musser et al. (Citation2005).
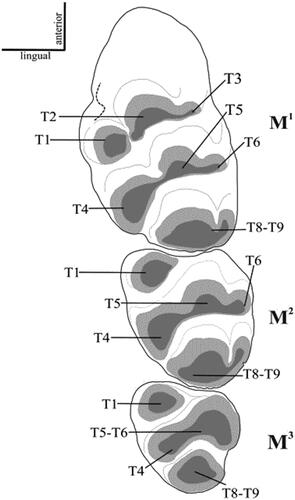
Figure 3. Notomys magnus sp. nov. A, QM F55835. Holotype. Left maxilla in left lateral view. B, The same in dorsal view, highlighting the proximal part of the zygomatic arch. Red arrows point to the broken part of the zygomatic arch, indicating the presence of additional missing bone from which it is inferred that the overall thickness of the anterior zygomatic arch would have been thicker.
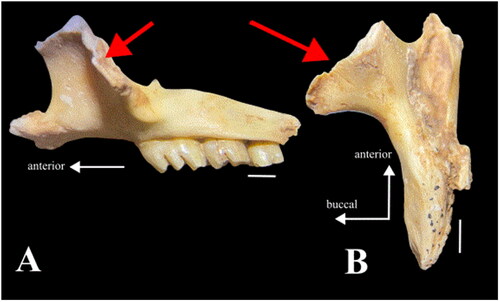
Figure 4. Notomys magnus sp. nov. A, QM F55835. Holotype. Left maxilla with M1-3. B–D, SEMs of M1, M2 and M3 of holotype QM F55835. E, QM F55832. SEM image of left upper first molar (M1); F, QM F60725. Left M1. G, H, QM F60723. Associated left maxilla fragments with M1 (G) and M2-3 (H). I, J, QM F60724. Associated left maxilla fragments with M1-2 (I) and M3 (J). Red bars indicate the positions of the incipient anterior lingual cusps on M1s. All scale bars equal 1 mm.
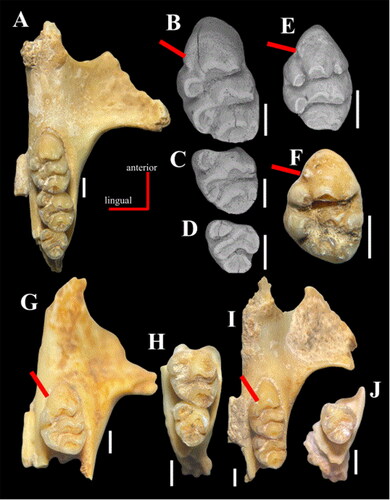
Figure 5. Comparison between the maxillae of two Notomys species. A, N. magnus sp. nov. from the Broken River region. B, Notomys longicaudatus from Mount Etna (see ). Note the well-developed buccal cusps of N. magnus and the relatively narrow posterior lophs of M1-2 of N. magnus, compared with those of N. longicaudatus. Scale bars equal 1 mm.
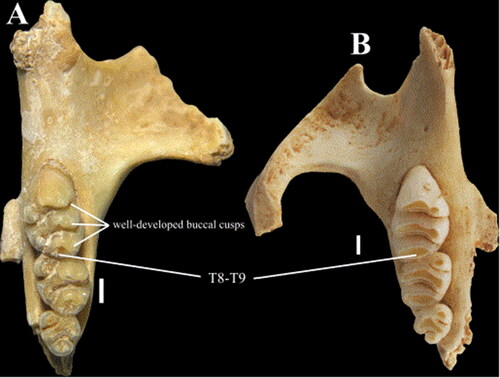
Table 1. Molar (M1-3) and zygomatic plate measurements for the examined specimens of Notomys magnus sp. nov.
Table 2. Measurements of range, mean and standard deviation for upper molar dimensions for Notomys magnus sp. nov.
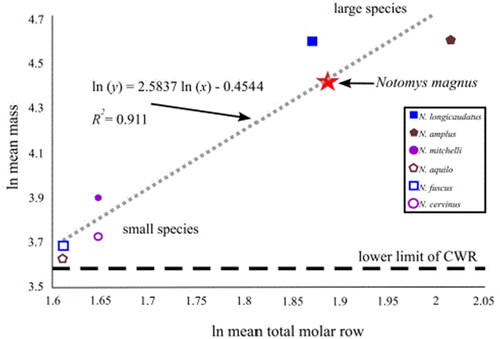
Figure 6. Plot of log mean mass against log mean total molar row (length) to estimate the mass of Notomys magnus sp. nov. Data for Notomys cervinus and Notomys fuscus from Tate (Citation1951), Notomys aquilo, Notomys mitchellii and Notomys amplus from Mahoney et al. (Citation2007) and Notomys longicaudatus from Thomas (Citation1921). Horizontal dashed line indicates the lower limit of the CWR (see text). Dental measurements for Notomys alexis were not clearly reported in literature and since it is a small-bodied species, it is likely to cluster with other smaller-bodied species and its absence therefore does not have any major effect on the regression line of the graph and the estimation of the mass of N. magnus.